Culture
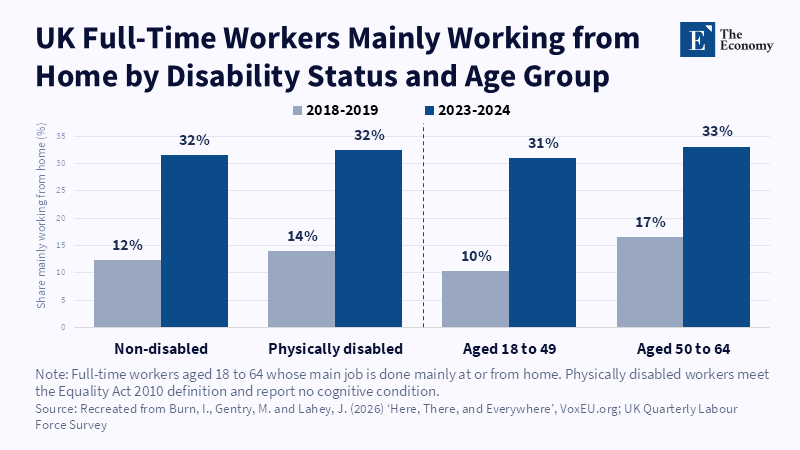
Figure: Home working nearly tripled in every group, so disabled workers gained the same access as everyone else. Related articles: Teleworking Bro
Read More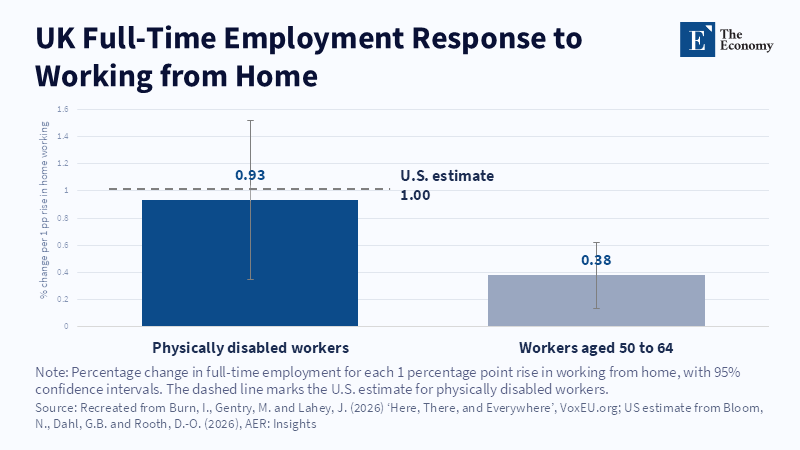
Figure: The UK estimate for disabled workers is close to the U.S.
Read More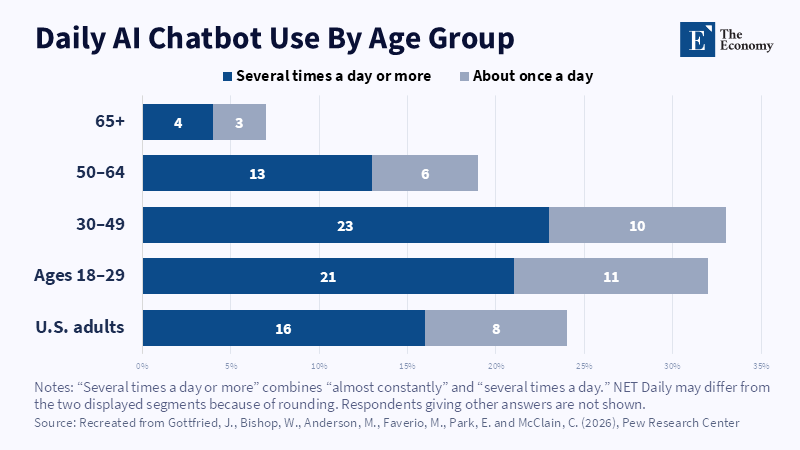
Figure 2: Daily chatbot use is highest among younger working-age adults. Related article: Age and AI Adoption:
Read More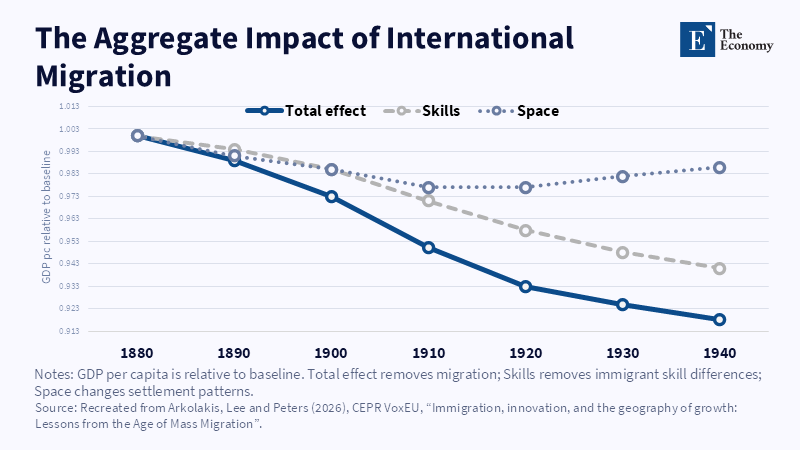
Figure 2: Skills account for most of the modeled GDP effect. Related article: Migration and Econom
Read More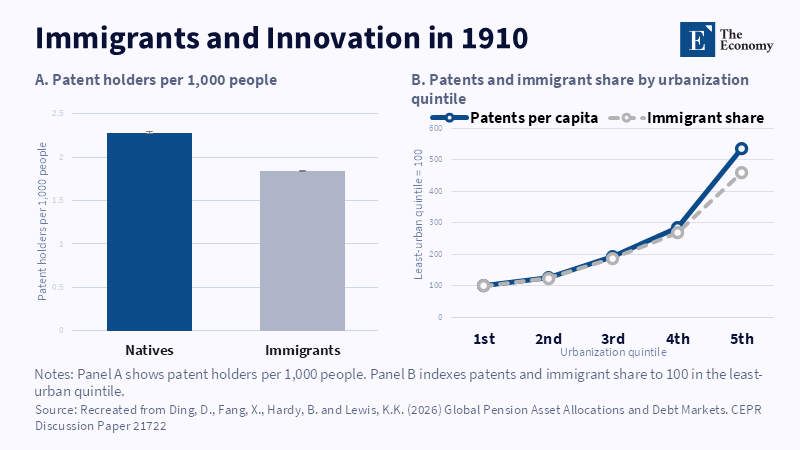
Figure 1: Patenting and immigrant concentration rose with urbanisation. Related article: Migration an
Read More







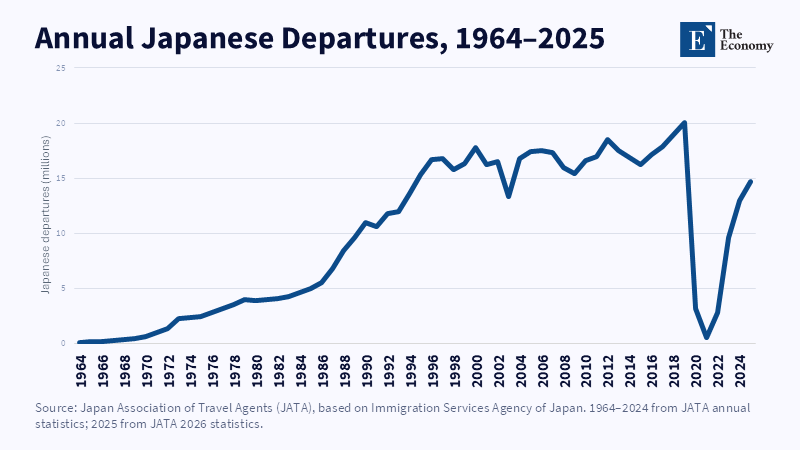
Figure 2: Japanese departures accelerated after 1985 and peaked in 2019. Related article: Weak Yen Explains
Read More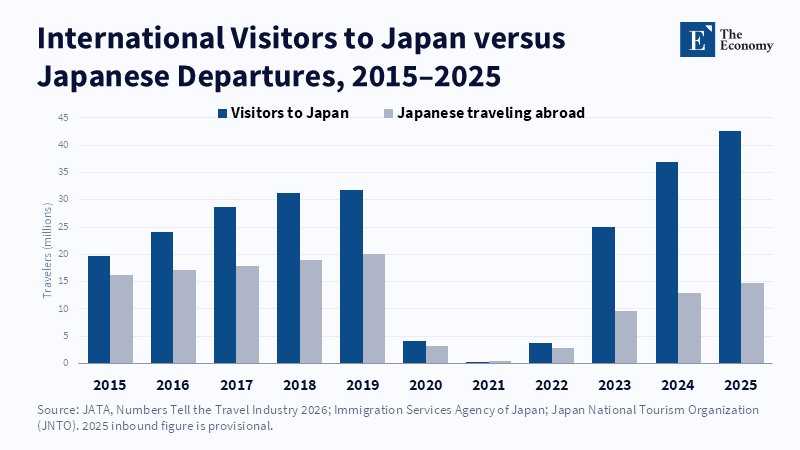
Figure 1: Inbound arrivals have surged while Japanese departures remain below 2019. Related article: Weak Ye
Read More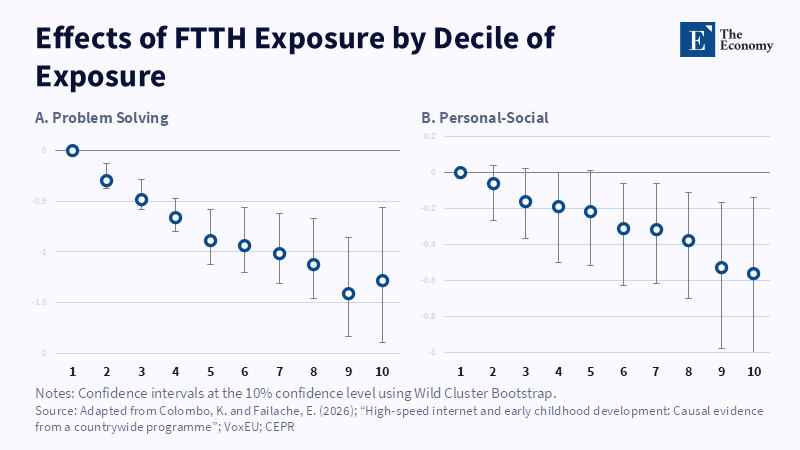
Note: Problem-solving and personal-social losses generally deepen as cumulative FTTH exposure rises. Related article: The Broadband Problem Is an Atte
Read More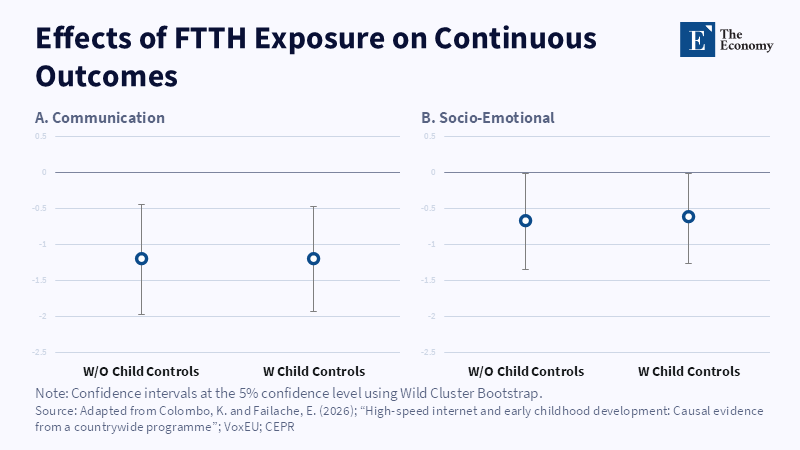
Note: FTTH exposure reduced communication and socio-emotional scores, with little change after child controls were added. Related article: The Broadban
Read More
Figure 2: Transfers can slow decline in the oldest prefectures, but the gain comes with a visible reduction in Tokyo’s population share. Related Article:
Read More

Figure 1: Tokyo’s projected rise and the oldest prefectures’ decline show that Japan’s demographic crisis is also a spatial planning problem. Related Articles:
Read More


