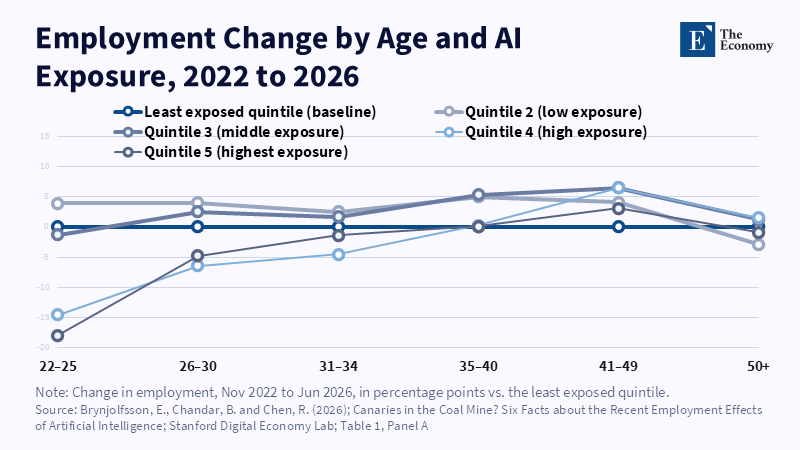
Figure: Only the youngest workers fall behind in the most exposed jobs; by the mid-thirties the gap has disappeared. Related articles: [Howie Chang Series] Will
Read More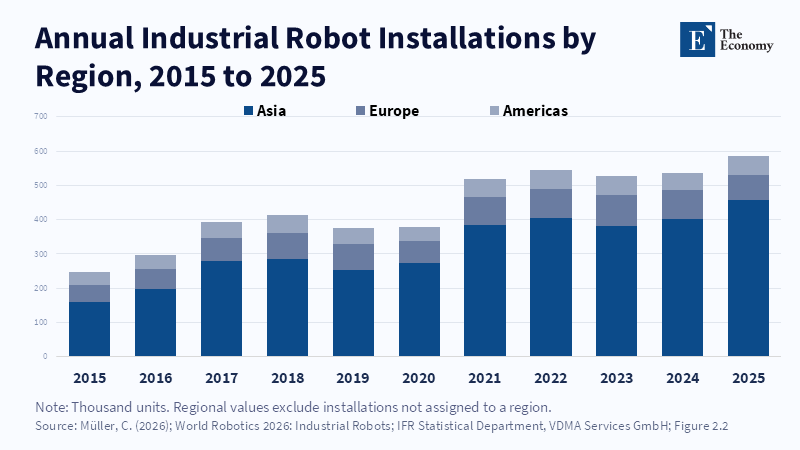
Figure: Robot installations have grown for a decade and Asia now absorbs three in every four. Related articles: [Howie Chang Series] Will Your Job be Replaced
Read More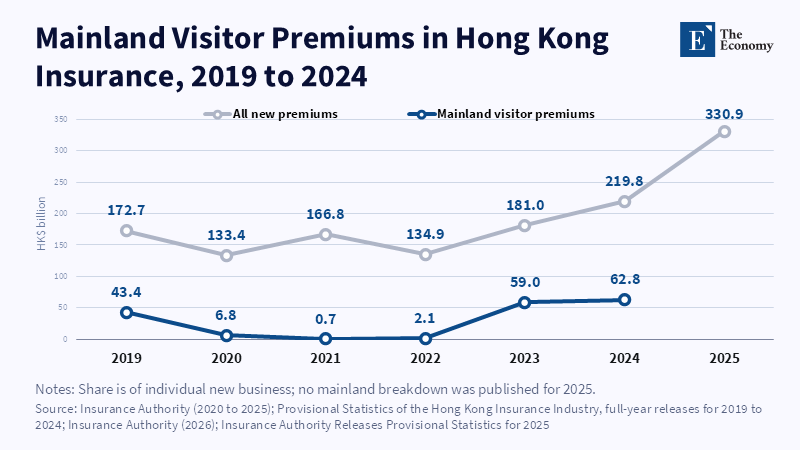
Figure 1: Mainland buyers came back to a third of new sales once the border reopened.
Read More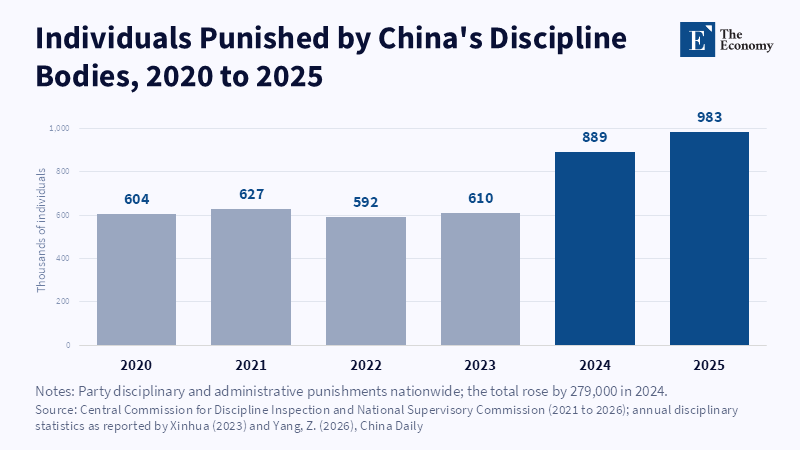
Figure: Punishments held near 600,000 for four years, then jumped 46 percent in 2024, the same year Beijing reopened channels to Hong Kong. Related articles:
Read More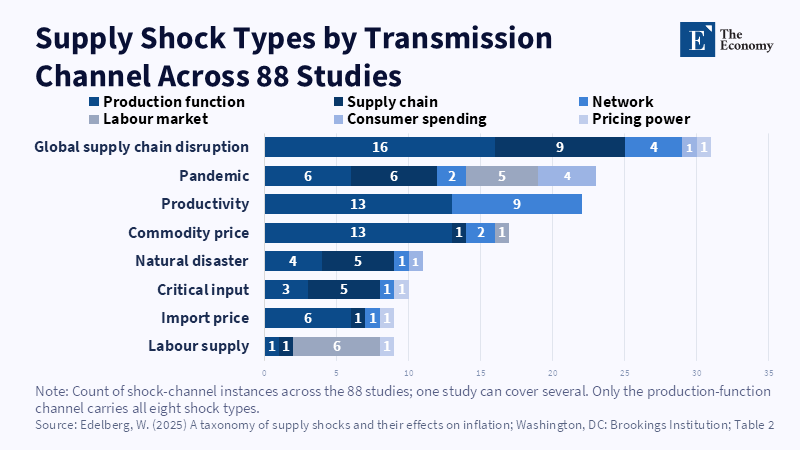
Figure: Commodity price shocks reach prices almost entirely through production costs, while supply chain and pandemic shocks spread across five channels at once. Related articles:
Read More







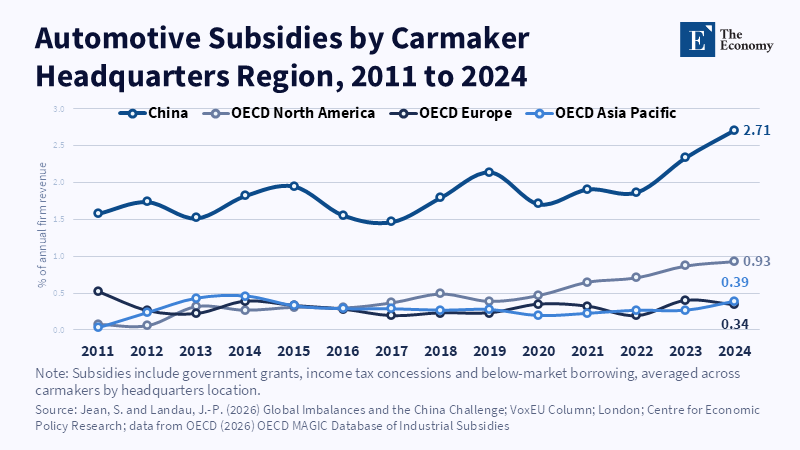
Figure: Chinese carmakers received subsidies worth 2.7 percent of revenue in 2024, nearly three times the North American rate and about seven times Europe’s. Related articles:
Read More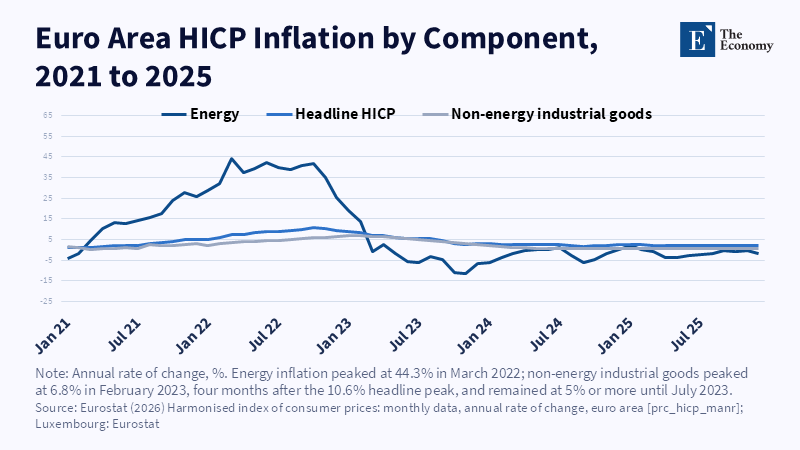
Figure: Energy inflation peaked in March 2022, but manufactured goods prices kept rising until February 2023, as the gas shock worked its way through factory costs. Related articles:
Read More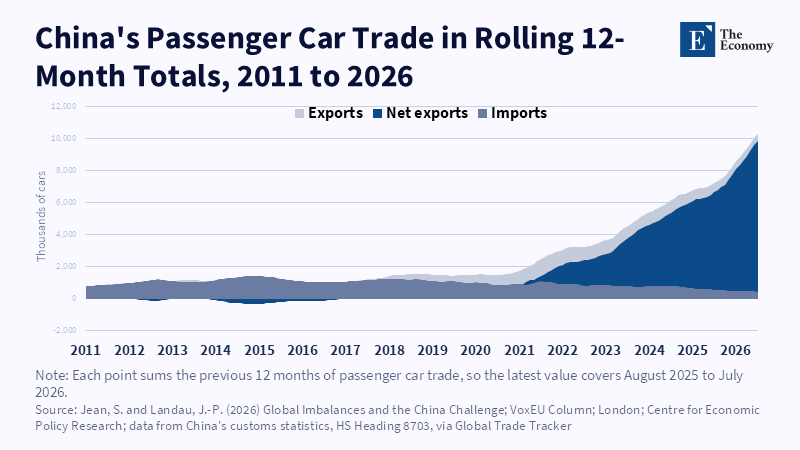
Figure: China imported more cars than it exported until 2017.
Read More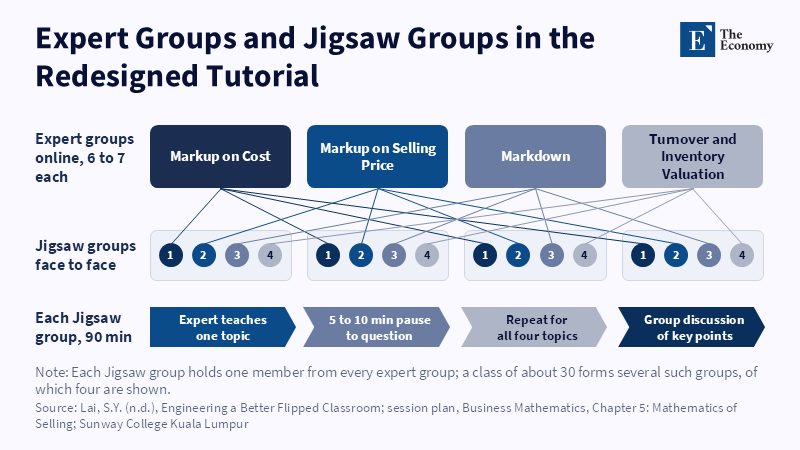
Figure: Each student arrives as the only expert on one topic, so no group can finish without hearing from every member. Related articles: Re
Read More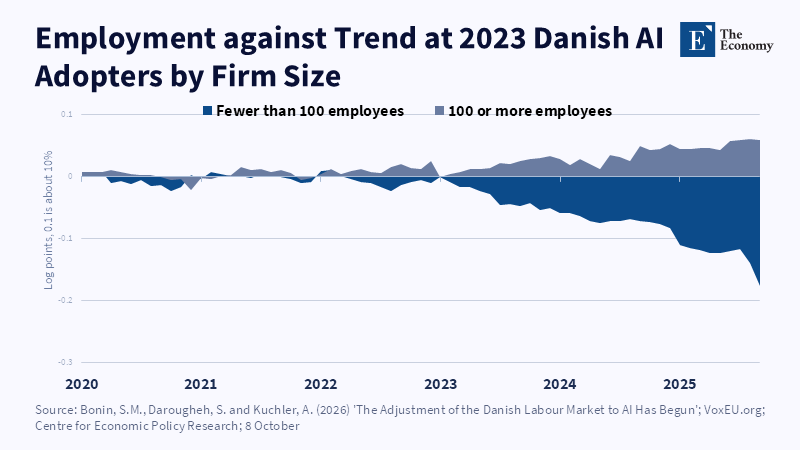
Figure: After adoption, small firms fell 16% below their own trend while larger firms edged above theirs. Related articles: AI and the D
Read More
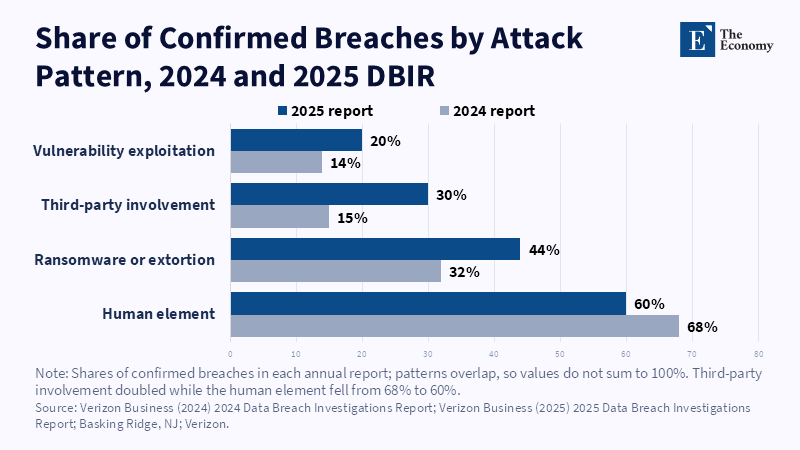
Figure: Third-party breaches doubled in a year as the human-element share slipped. Related articles: [Howie Chang Series] Is AI in Cybersecurity a
Read More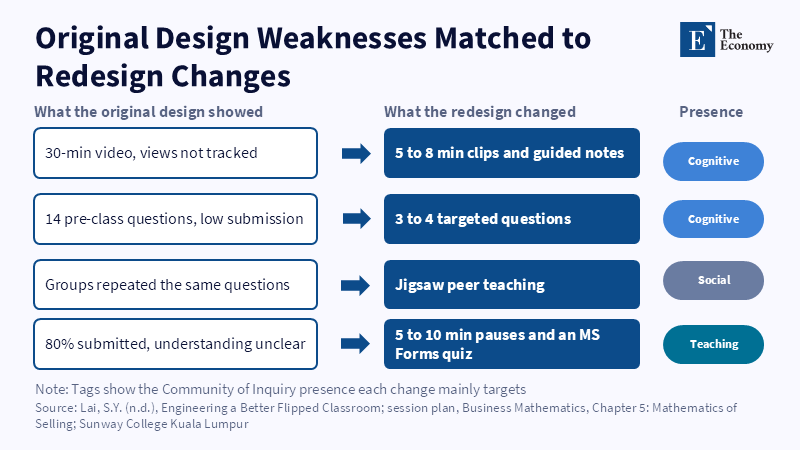
Figure: Each change answers a specific failure Lai observed, rather than adding technology for its own sake. Related articles: Redesigning
Read More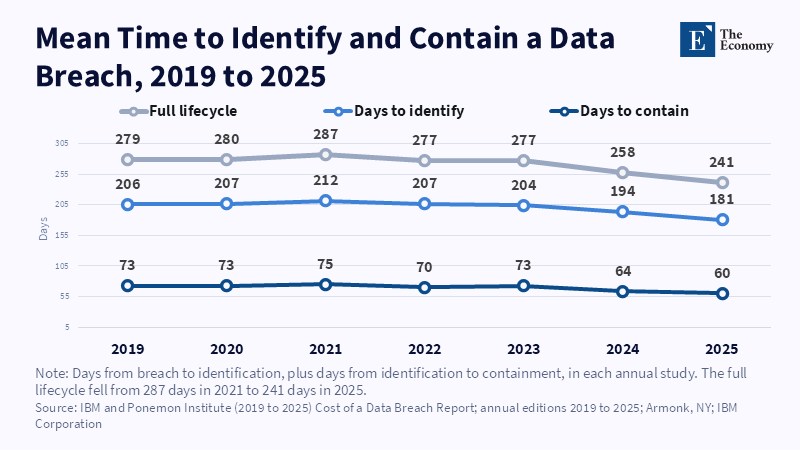
Figure: Breach lifecycles shortened by 46 days from 2021 to 2025, mostly at detection. Related articles: [Howie Chang Series] Is AI in Cybersecuri
Read More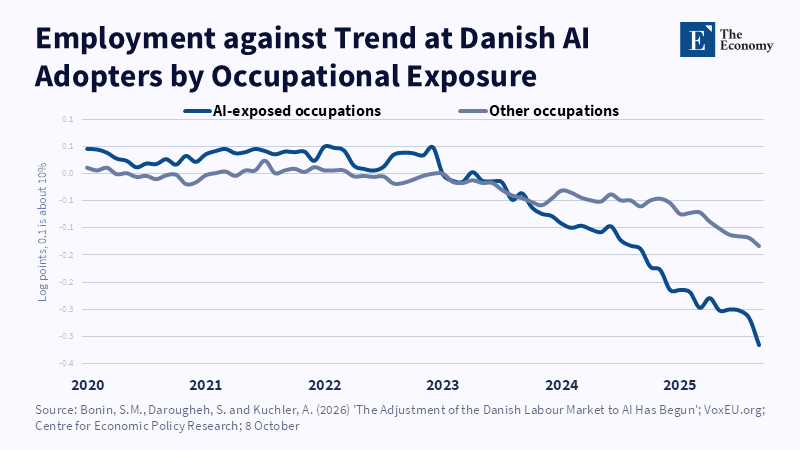
Figure: Exposed and unexposed jobs moved together until early 2023, after which the exposed line fell more than twice as far. Related articles:
Read More
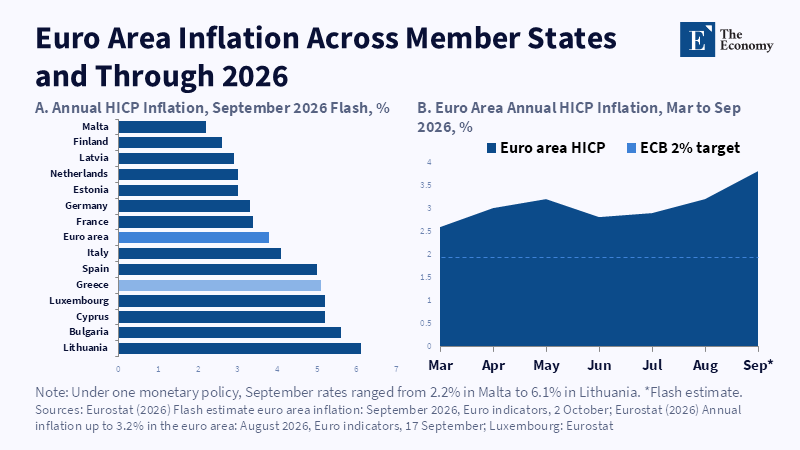
Related article: Geopolitical Shocks and Inflation: The Magnitude of the Crisis Determines the Price Path
Read More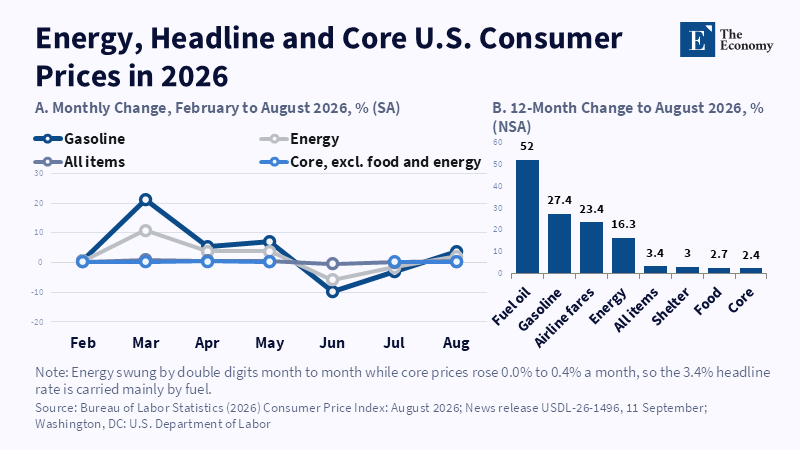
Figure 1: Gasoline jumped 21.2% in March alone while core prices never rose more than 0.4% a month. Related article:
Read More
Related articles: U.S.
Read More