Education
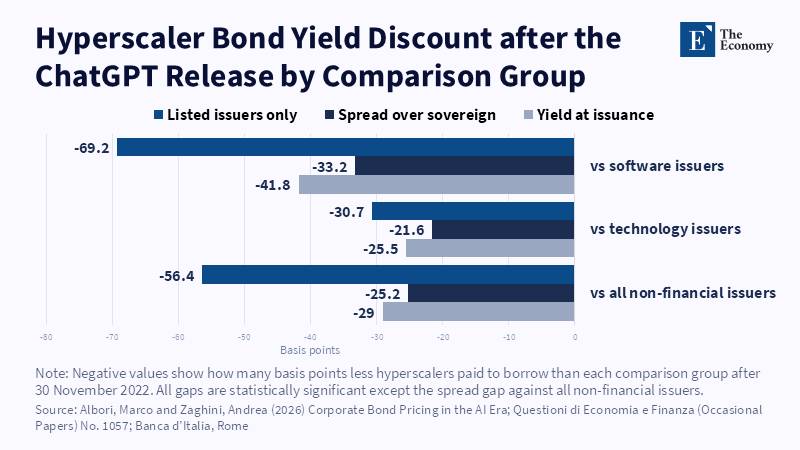
Figure: The discount is largest against software issuers, 42 basis points at issuance and 69 among listed firms and holds under every measure. Related articles:
Read More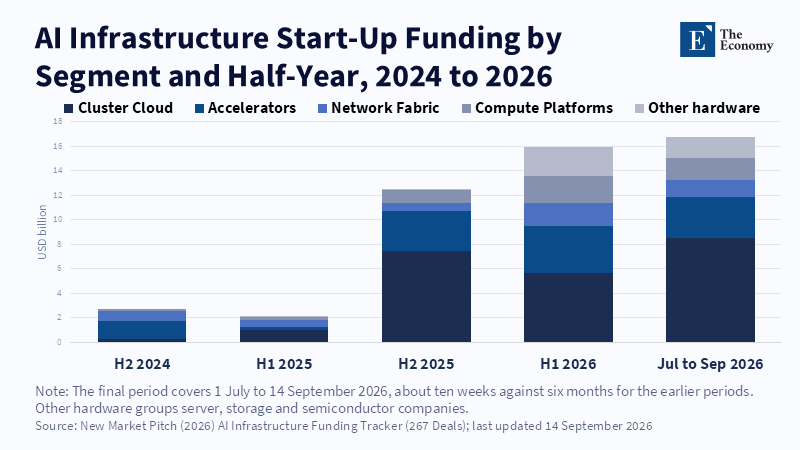
Figure: Neoclouds took the largest share in each of the last four periods and ten weeks of 2026 drew more capital than the whole first half. Related articles:
Read More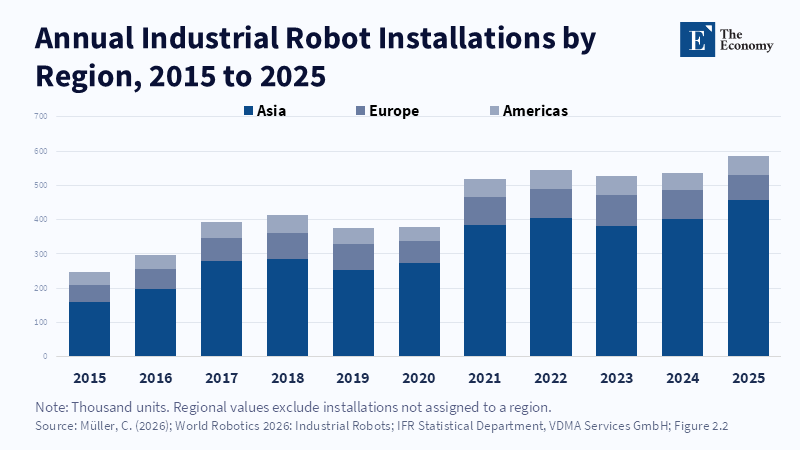
Figure: Robot installations have grown for a decade and Asia now absorbs three in every four. Related articles: [Howie Chang Series] Will Your Job be Replaced
Read More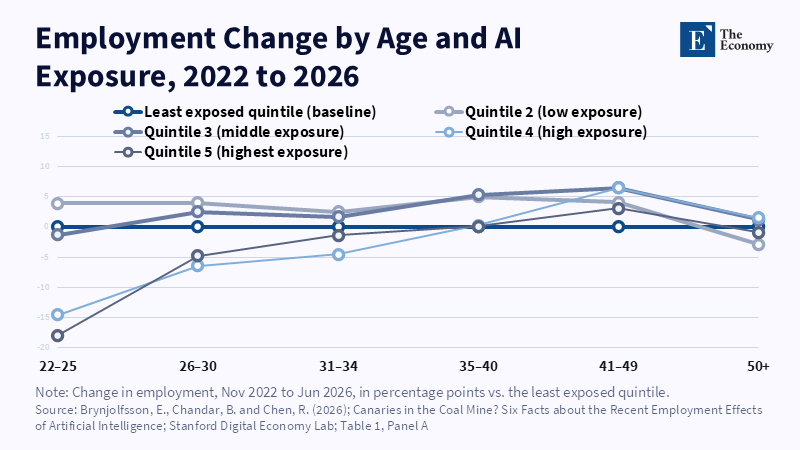
Figure: Only the youngest workers fall behind in the most exposed jobs; by the mid-thirties the gap has disappeared. Related articles: [Howie Chang Series] Will
Read More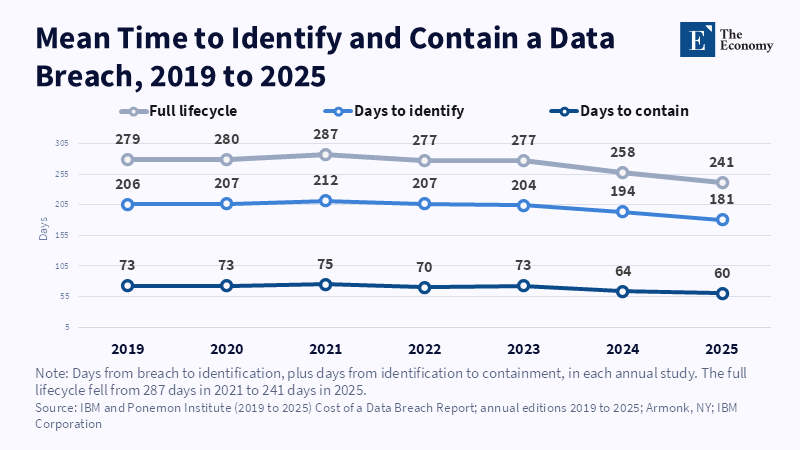
Figure: Breach lifecycles shortened by 46 days from 2021 to 2025, mostly at detection. Related articles: [Howie Chang Series] Is AI in Cybersecuri
Read More




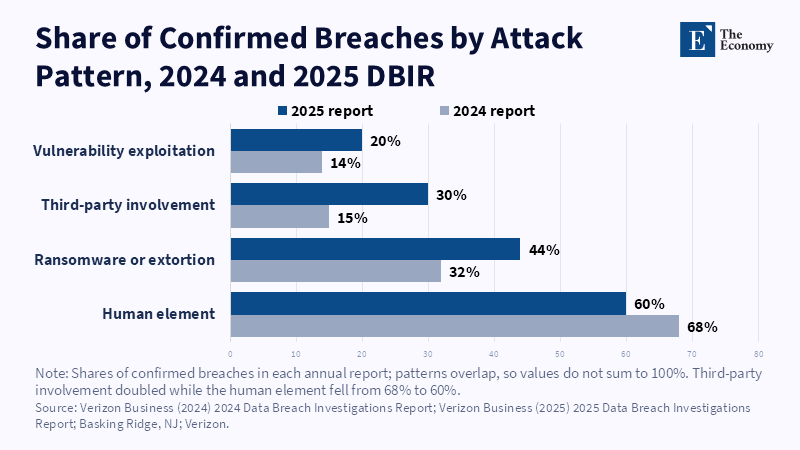
Figure: Third-party breaches doubled in a year as the human-element share slipped. Related articles: [Howie Chang Series] Is AI in Cybersecurity a
Read More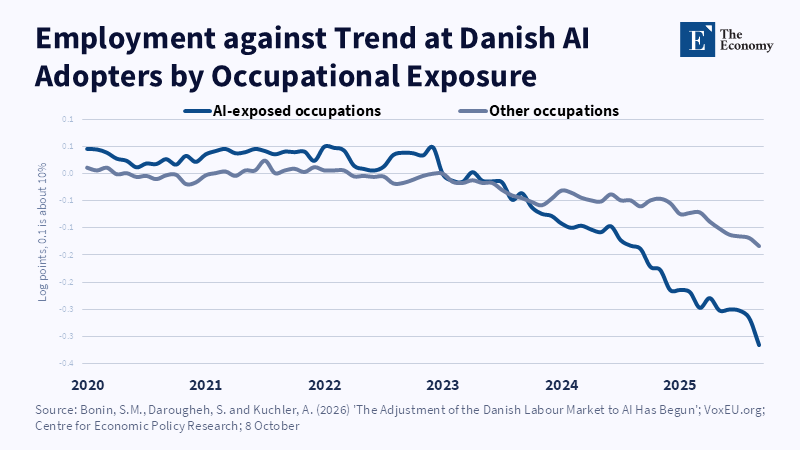
Figure: Exposed and unexposed jobs moved together until early 2023, after which the exposed line fell more than twice as far. Related articles:
Read More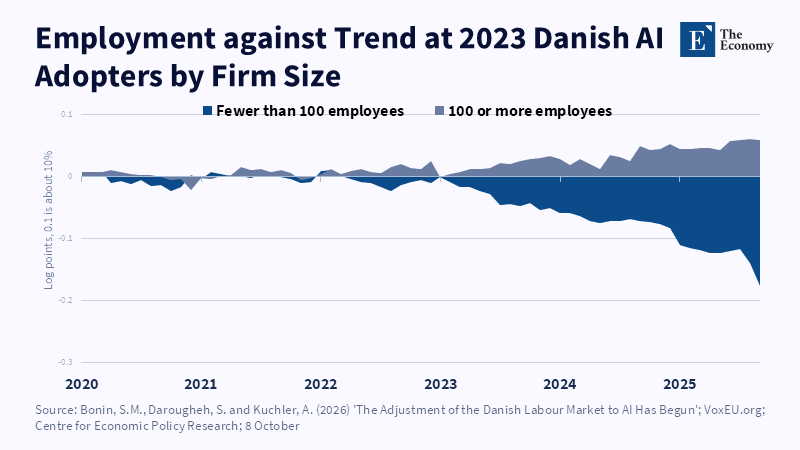
Figure: After adoption, small firms fell 16% below their own trend while larger firms edged above theirs. Related articles: AI and the D
Read More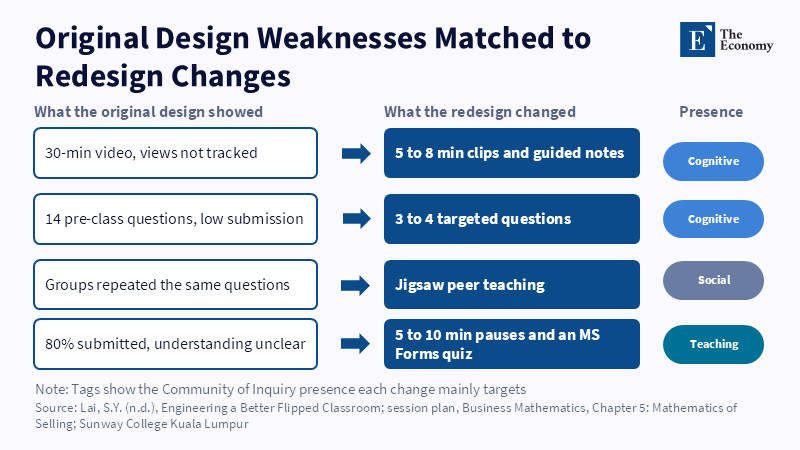
Figure: Each change answers a specific failure Lai observed, rather than adding technology for its own sake. Related articles: Redesigning
Read More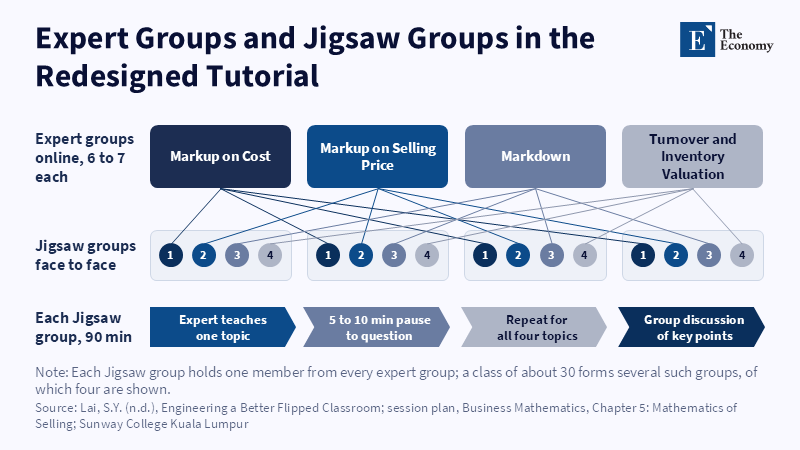
Figure: Each student arrives as the only expert on one topic, so no group can finish without hearing from every member. Related articles: Re
Read More
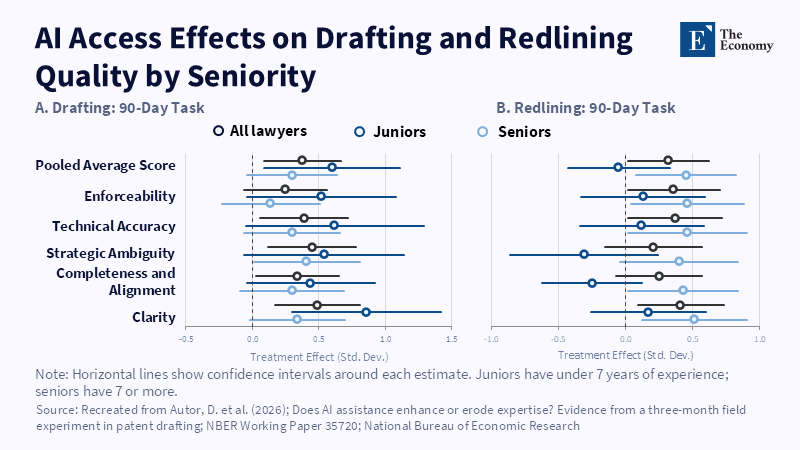
Figure 1: AI lifted junior drafts most, yet only seniors kept the gain without it. Related article: AI Tr
Read More
Figure 2: Treated juniors split toward both very low and good scores; treated seniors shifted upward. Related article:
Read More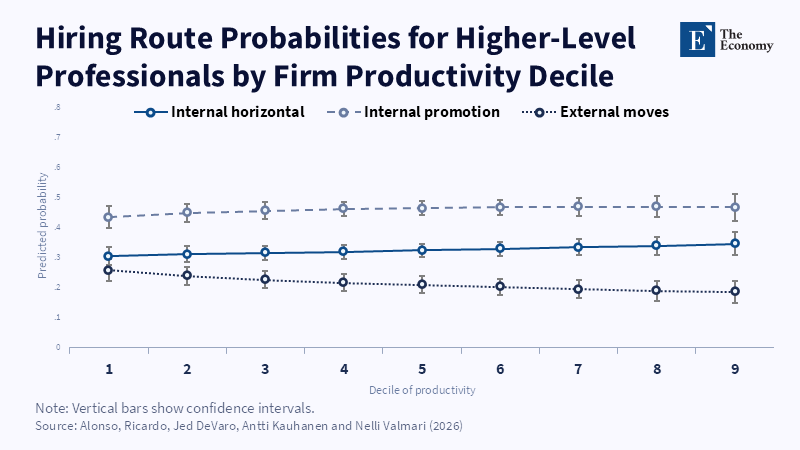
Figure 1: External hiring of professionals drops from about 26 percent to 19 percent in more productive firms, while internal promotion stays near 45 percent.
Read More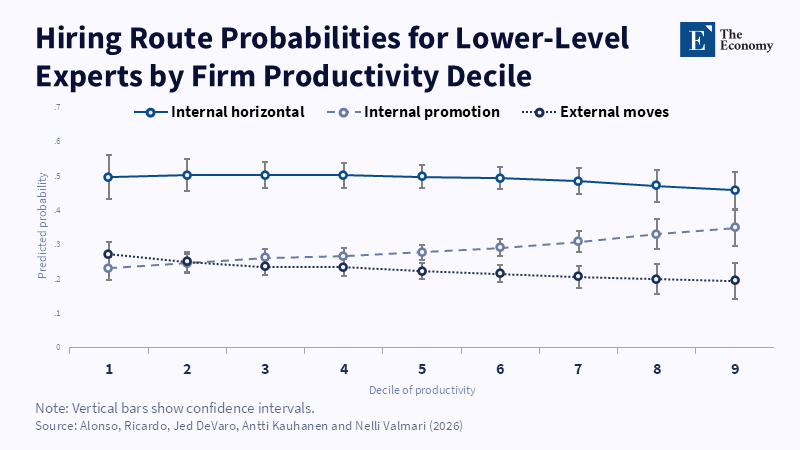
Figure 2: For lower-level experts, internal promotion climbs from about 23 percent to 35 percent and overtakes external hiring by the third decile.
Read More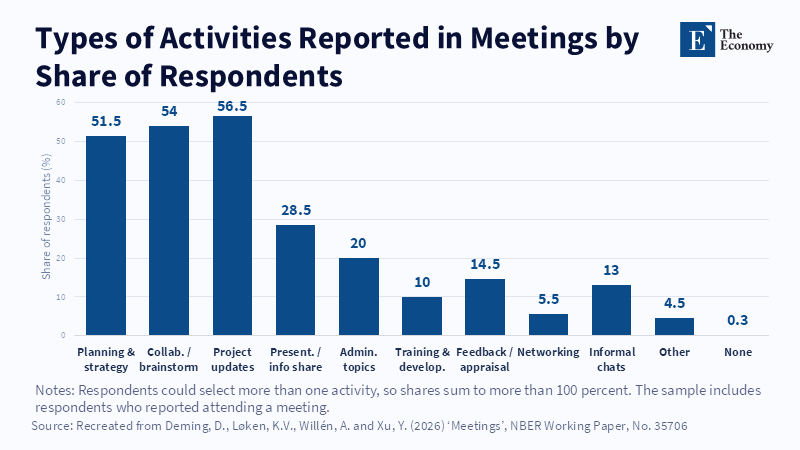
Figure 1: Planning, collaboration and project updates dominate workplace meetings. Related article:
Read More
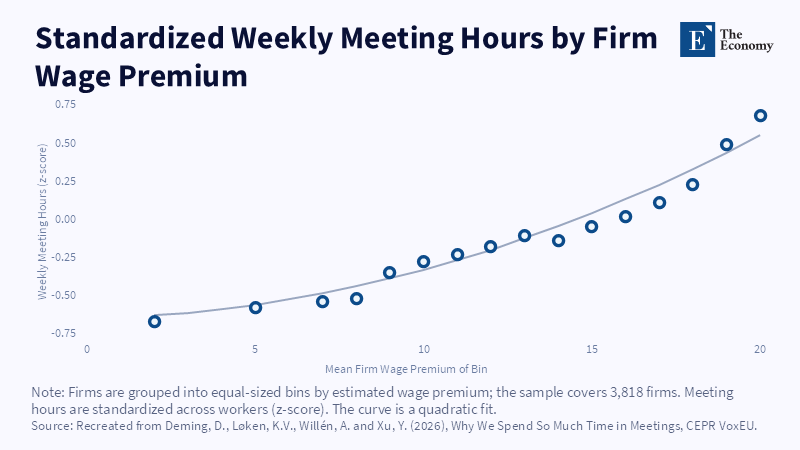
Figure 2: Firms with higher wage premia tend to report more weekly meeting time. Related article: W
Read More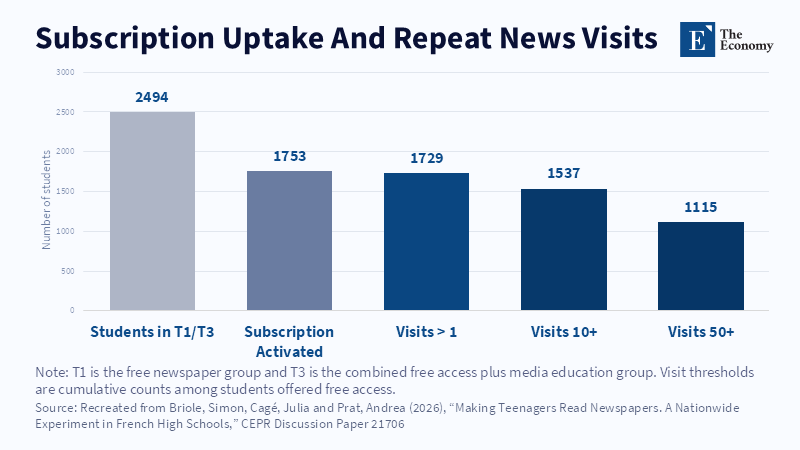
Figure 1: Repeated visits show measurable engagement beyond reported interest. Related article: Ma
Read More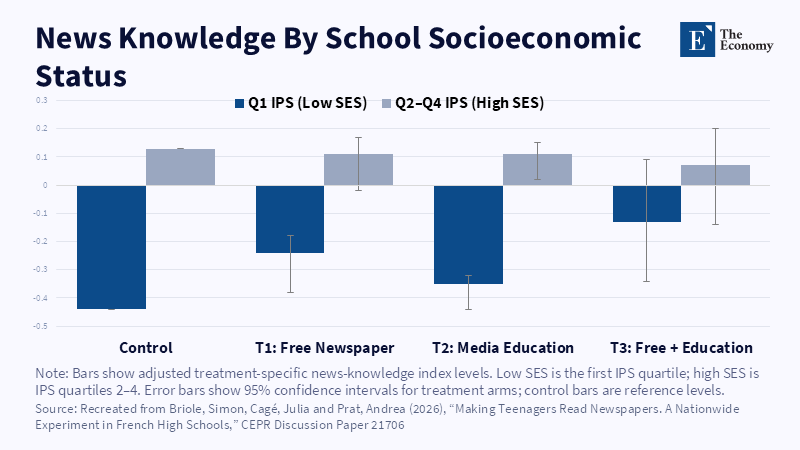
Figure 2: Knowledge gains were concentrated in lower-SES schools. Related article: Making Teena
Read More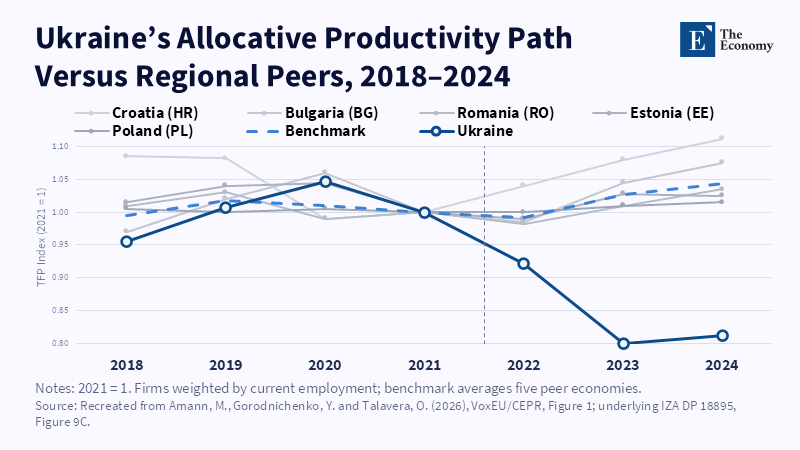
Figure 1: Ukraine’s allocative productivity diverged sharply from regional peers after 2021. Related article:
Read More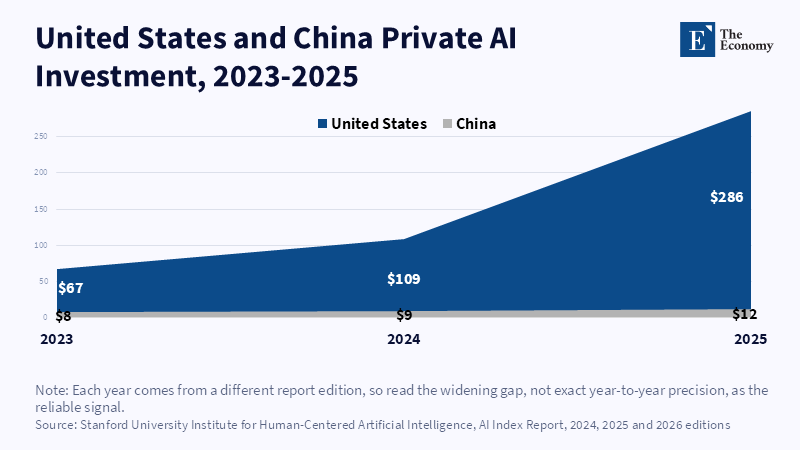
Figure 1. The US lead in private AI investment highlights the financial scale confronting middle powers.
Read More