Arctic Maritime Strategy
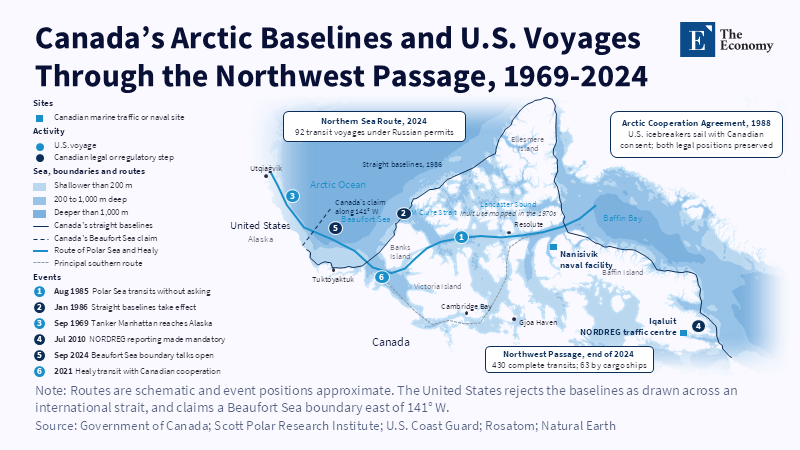
Figure: Canada’s baselines close both ends of the passage, so every U.S.
Read More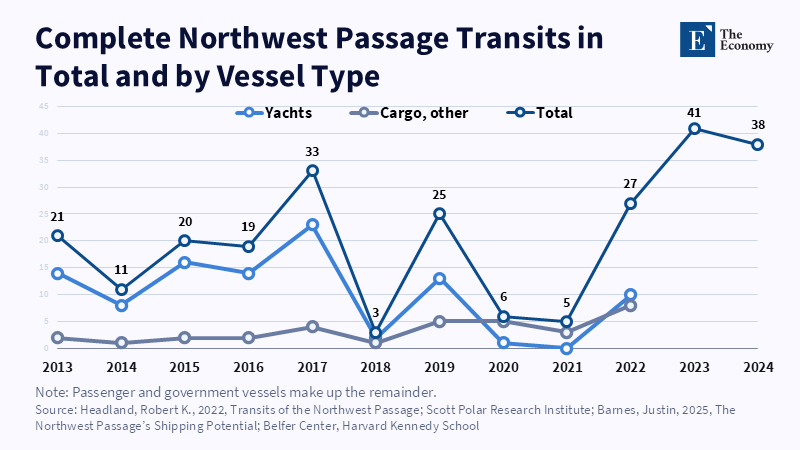
Figure: Yachts make up most transits, and cargo ships rarely exceed a handful a season.
Read More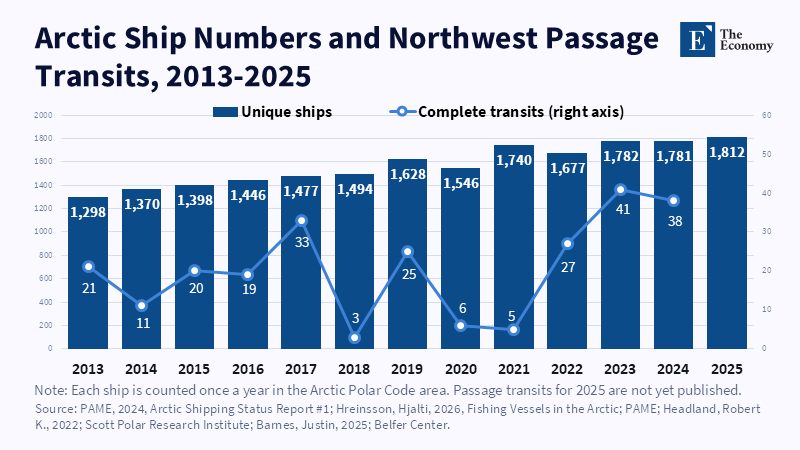
Figure: Arctic shipping grew 40 percent in twelve years, yet passage transits swung between 3 and 41 with ice and Canadian rules. Related articles:
Read More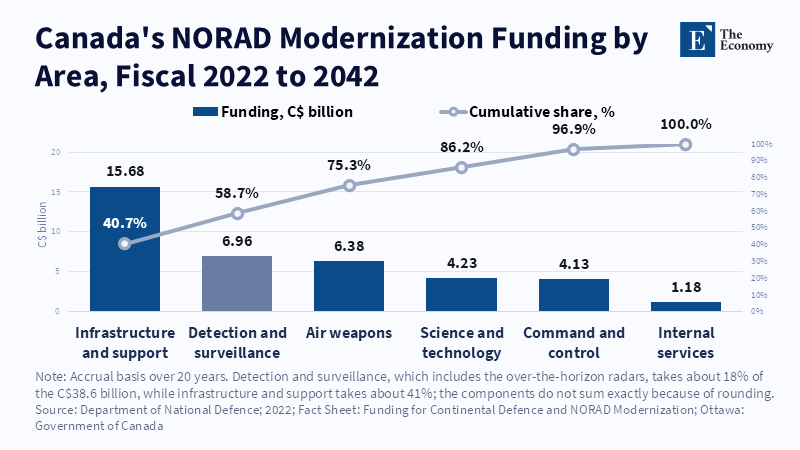
Figure: Only about 18% of the C$38.6 billion goes to detection and surveillance. Related articles: [Arctic Maritime Strategy] Canada’s Northwes
Read More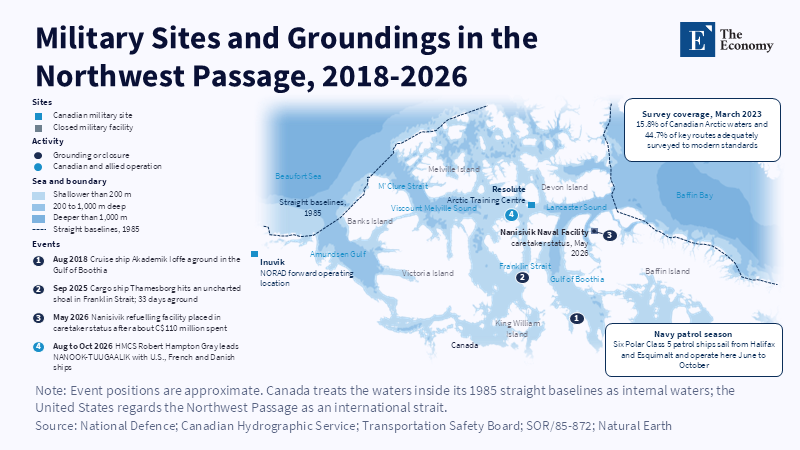
Figure: The baselines enclose the whole Archipelago, yet the only northern naval facility is closed. Related articles: [Arctic Maritime Strategy]
Read More







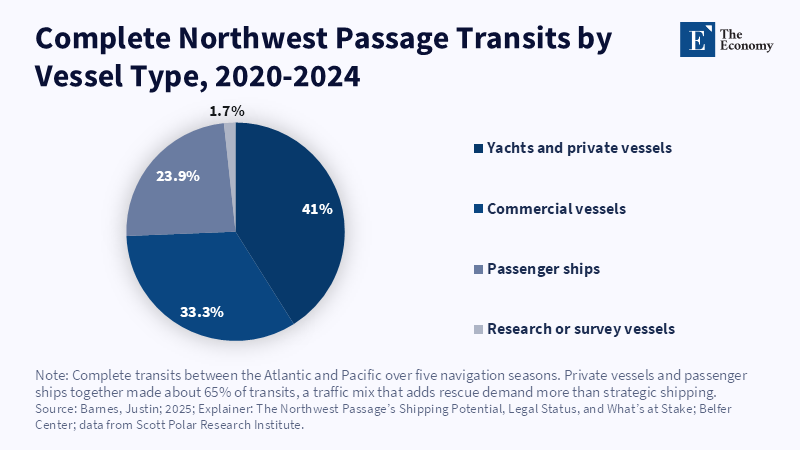
Figure: Most transits are private and passenger vessels, which adds rescue demand. Related articles: [Arctic Maritime Strategy] Canada’s Northwe
Read More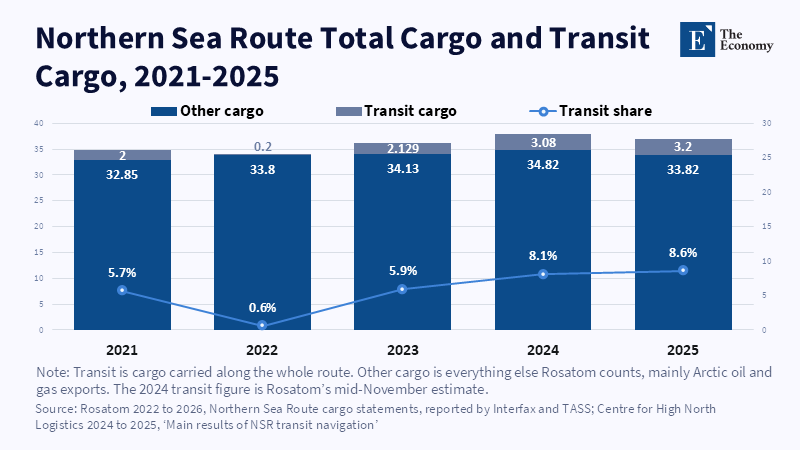
Figure: Transit hit a record 3.2 Mt in 2025, still under one tonne in eleven. Related articles: [Arctic Maritime Strat
Read More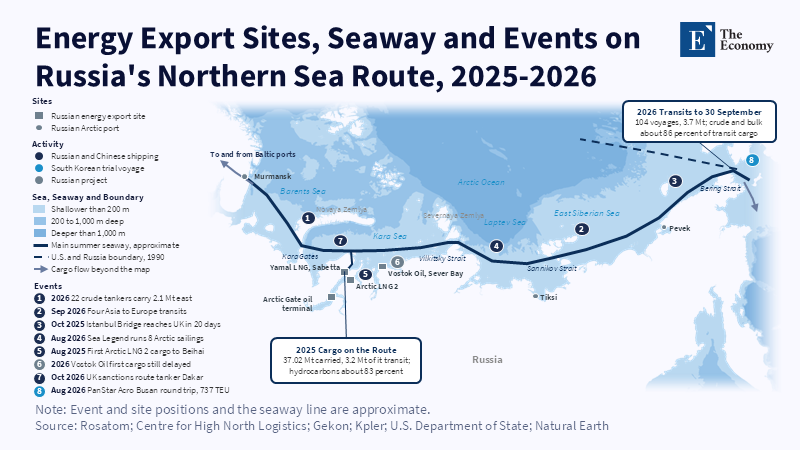
Figure: Export sites cluster at the Gulf of Ob; east of them the route thins to one seasonal lane. Related articles: [A
Read More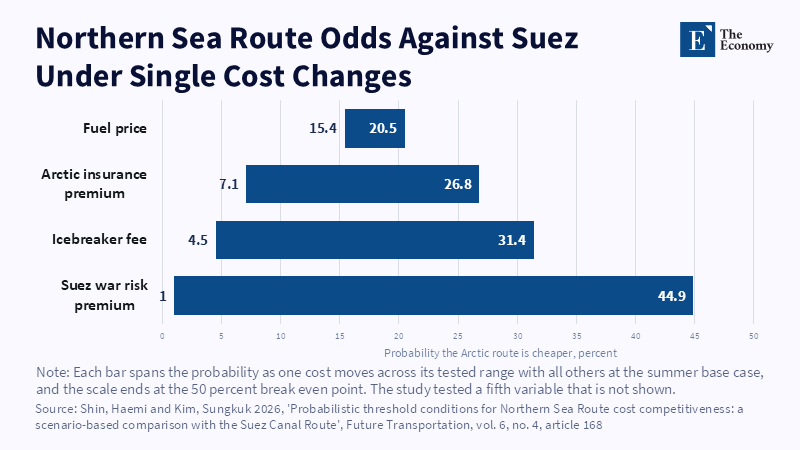
Figure: Even a full Red Sea war-risk premium leaves the Arctic route short of even odds. Related articles: [Arctic Ma
Read More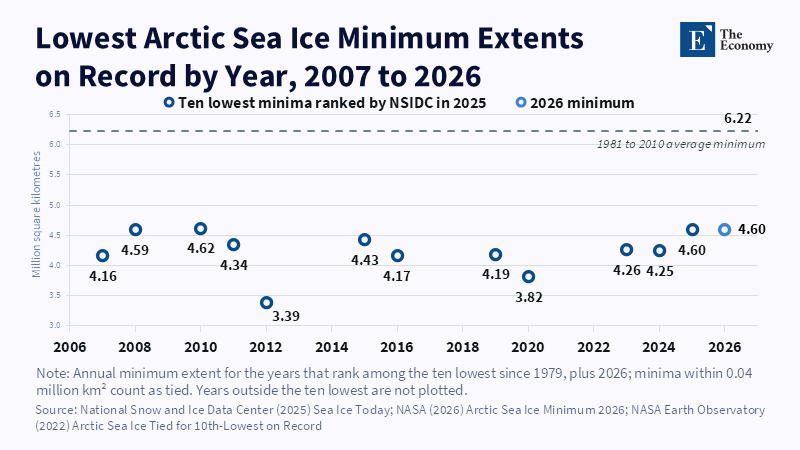
Figure: A decade without further retreat keeps Russia’s ice-based claim intact for now. Related articles: [Arctic Maritime Strategy]
Read More
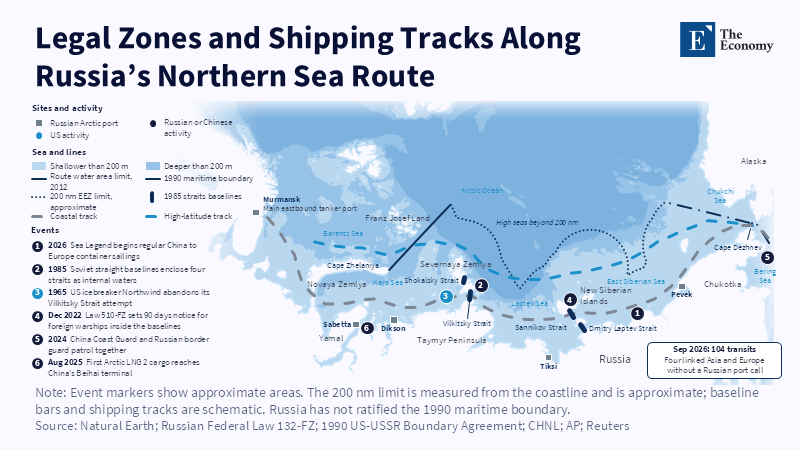
Figure: The coastal track runs through straits Moscow calls internal; northern tracks reach open sea. Related articles: [Arctic Mariti
Read More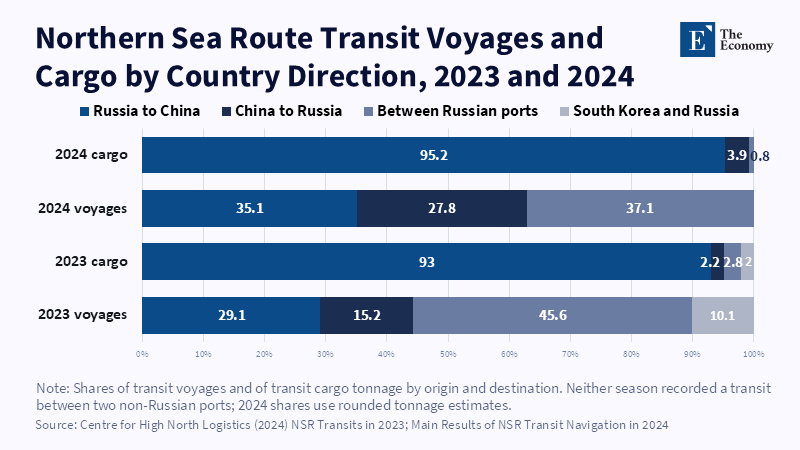
Figure: Russia-to-China sailings are a third of voyages but 93 to 95% of cargo. Related articles: [Arctic Maritime Strategy] Control
Read More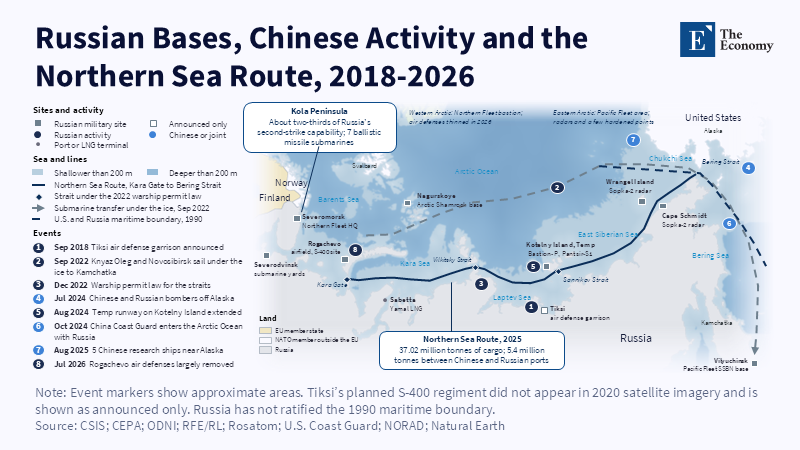
Figure: Russia guards Kola heavily; the eastern route is mostly watched, not defended. Related articles: [Arctic Maritime Strategy] Russ
Read More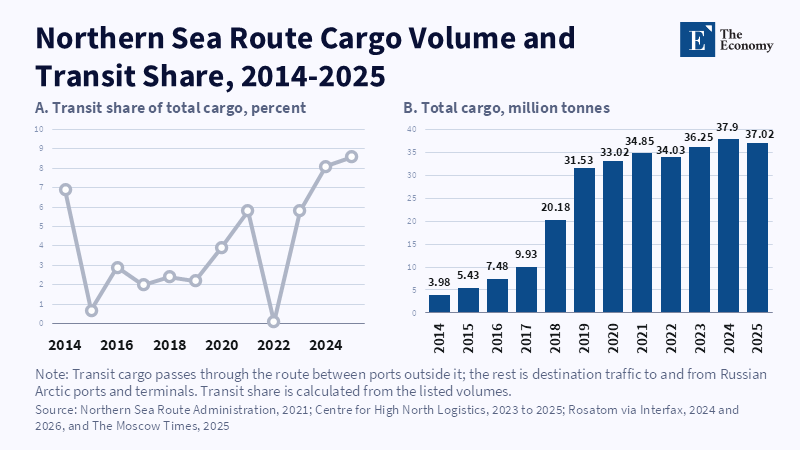
Figure: Cargo grew ninefold but transit never passed 9 percent. Related articles: [Arctic Maritime Strategy] Russia's Arctic Milit
Read More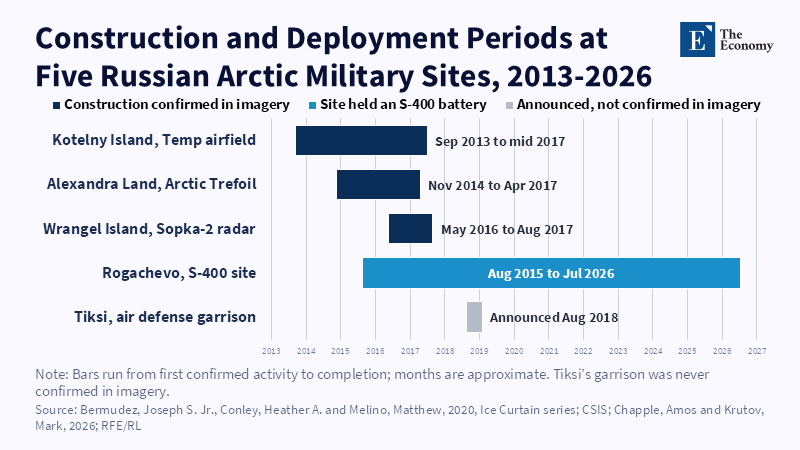
Figure: Eastern bases were finished before transit traffic existed. Related articles: [Arctic Maritime Strategy] Russia's Arctic
Read More
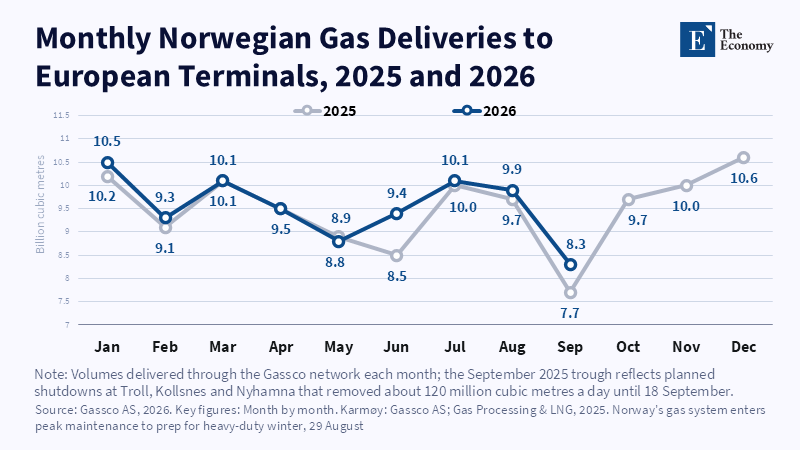
Figure: Planned September shutdowns cut flows by nearly a quarter, a preview of what an unplanned outage would do. Related articles:
Read More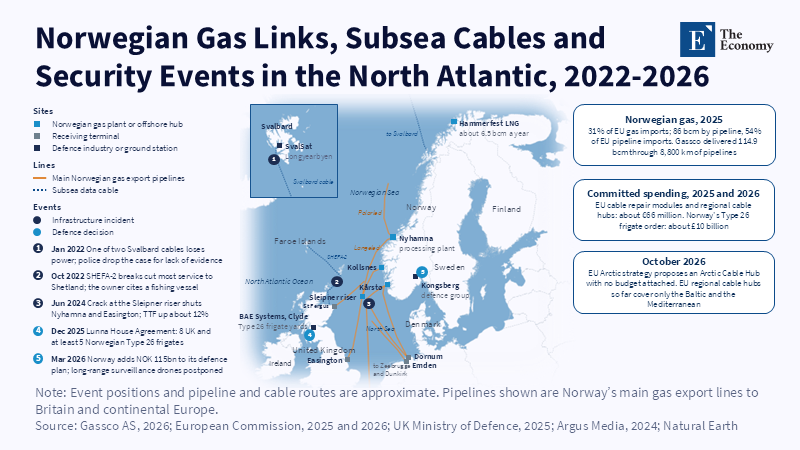
Figure: Europe’s gas and data lifelines converge on a few Norwegian and British points, and the documented incidents so far trace back to accidents. Related articles:
Read More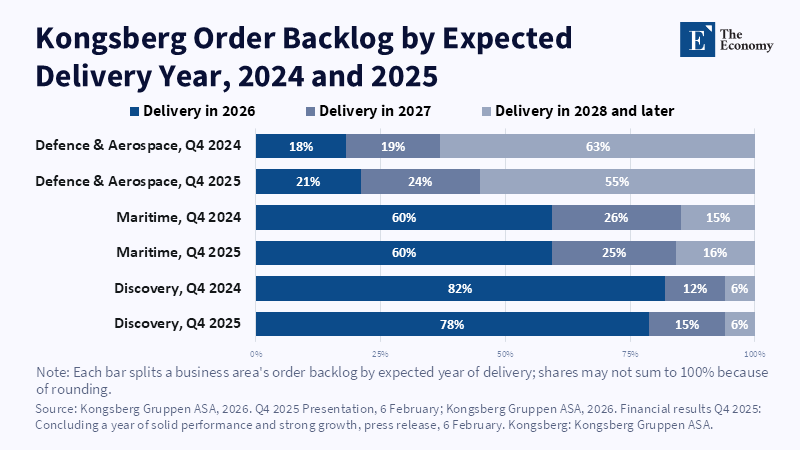
Figure: More than half of Kongsberg’s defence backlog is not delivered until 2028 or later, so the new spending reaches the water slowly. Related articles:
Read More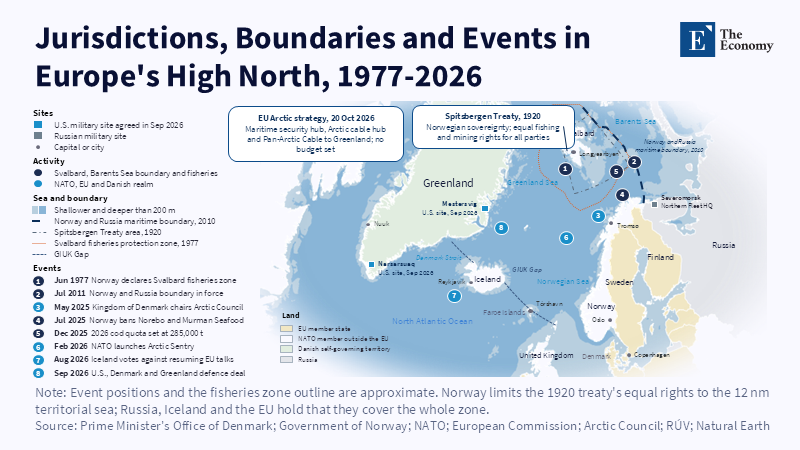
Figure: Every coastline around the GIUK Gap belongs to a NATO state, yet none of it is EU territory. Related articles: [Arctic Mar
Read More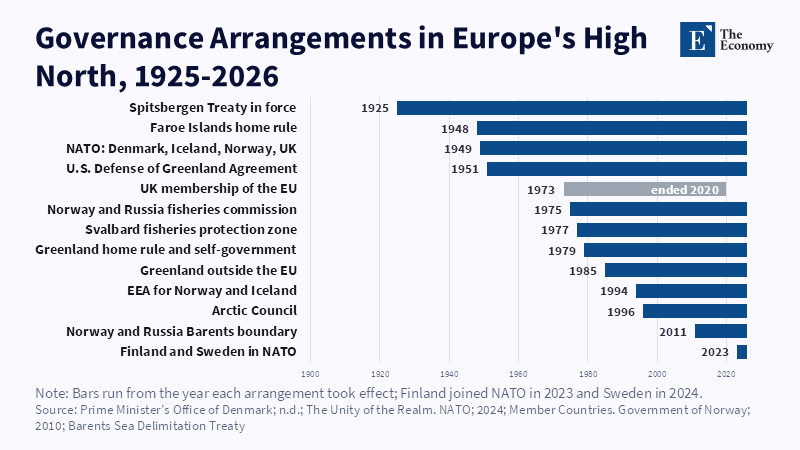
Figure: Most governance layers are decades old; newer security deals sit on top. Related articles: [Arctic Maritime Strategy] Who
Read More