Capital Market
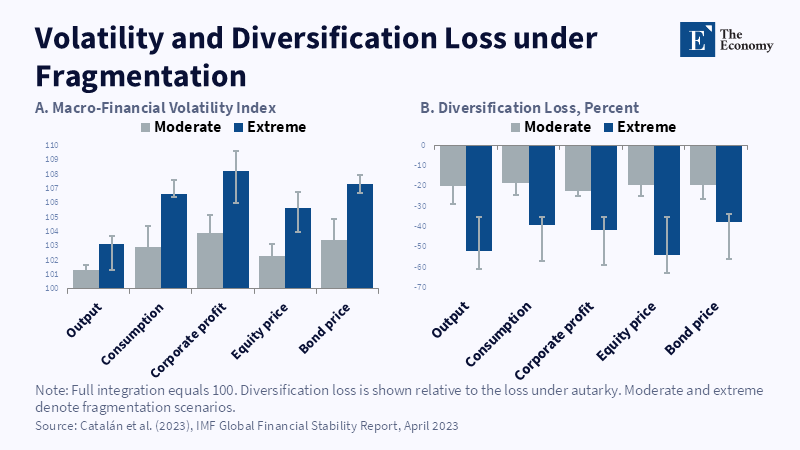
Figure 2: Extreme fragmentation raises volatility by up to about 8 points and diversification losses reach 38 to 54 percent of the autarky loss. Related article:
Read More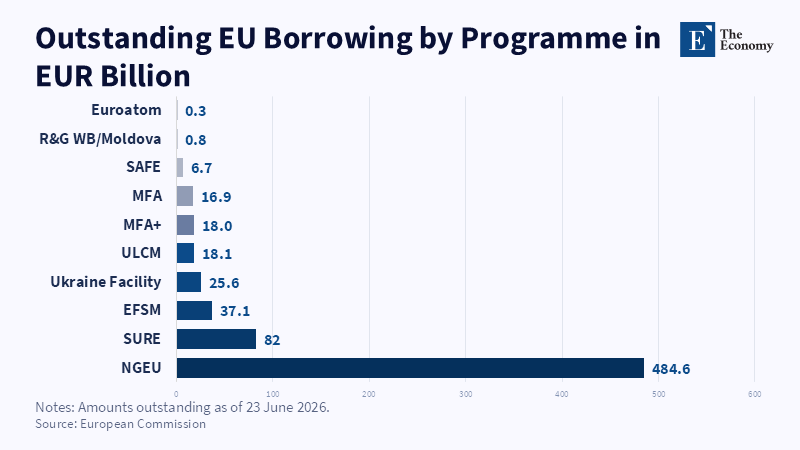
Figure 1: NextGenerationEU makes up about 70 percent of the €690.5 billion outstanding, far ahead of SURE and SAFE. Related article:
Read More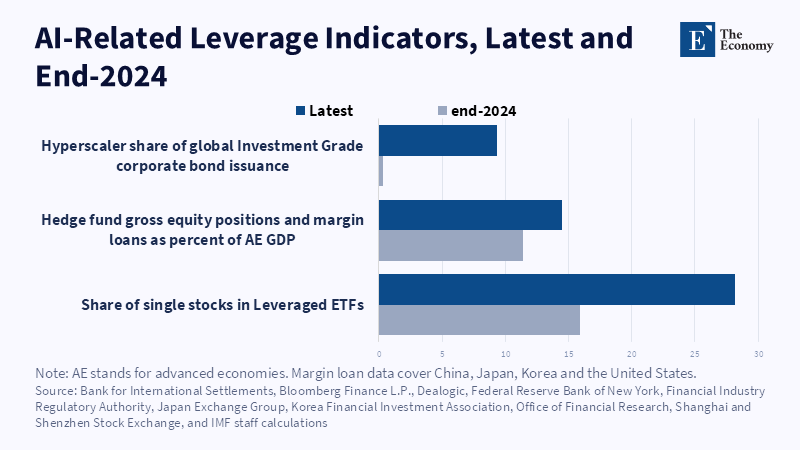
Figure 2: AI-related investment exposure has increased across several leveraged market indicators. Related article:
Read More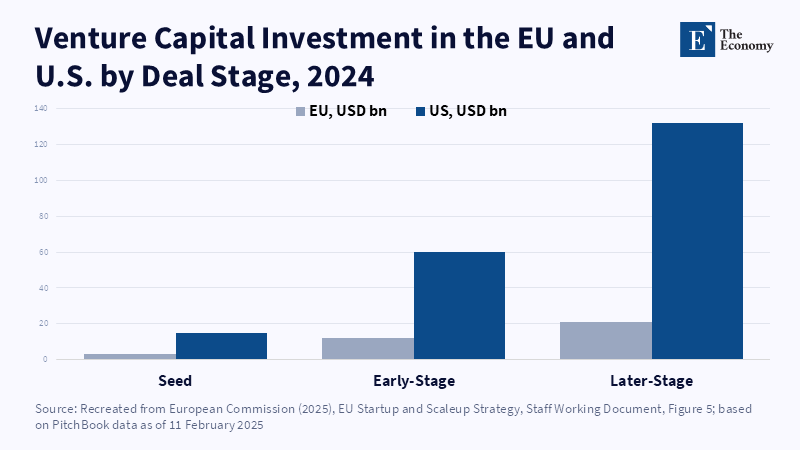
Figure 2: The EU funding gap remains substantial across growth stages. Related article: Europe Joined
Read More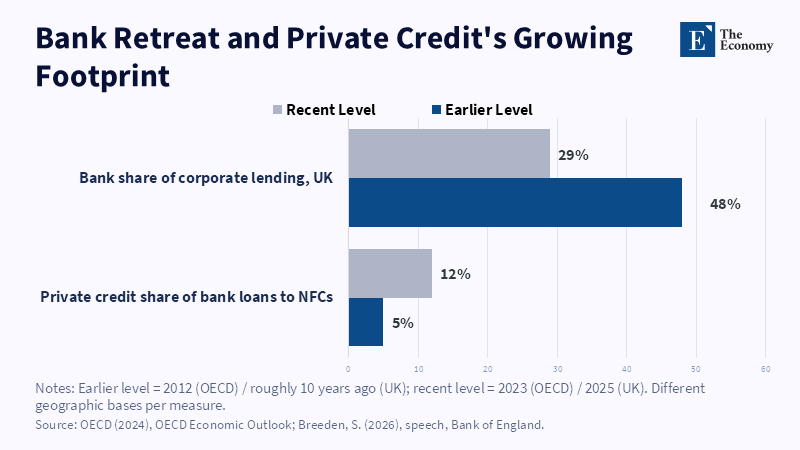
Figure 2: As banks' share of corporate lending fell, private credit's share of bank loans to non-financial corporations more than doubled.
Read More







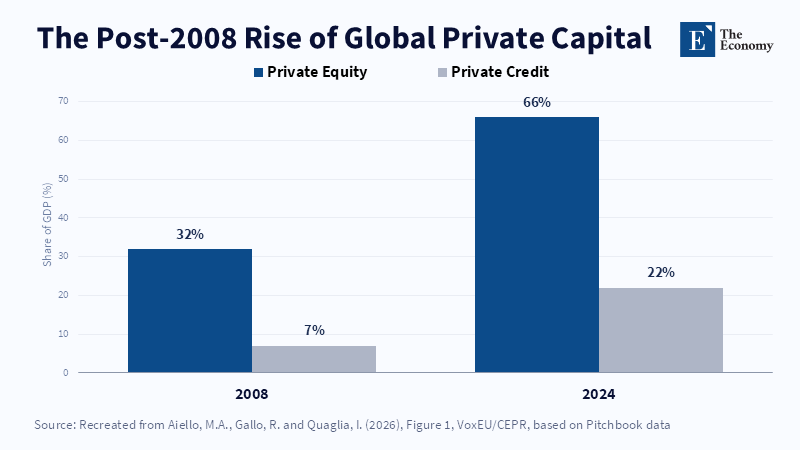
Figure 1: Private equity and private credit assets grew sharply relative to GDP between 2008 and 2024, with private credit nearly tripling its share. Related article:
Read More