Financial
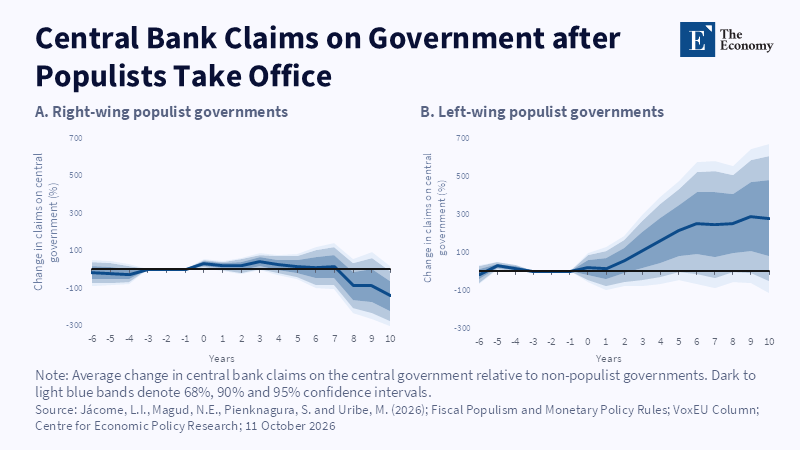
Figure: A decade after left-wing populists take office, central bank claims on the state are up close to 300%, while right-wing governments leave no lasting rise. Related articles:
Read More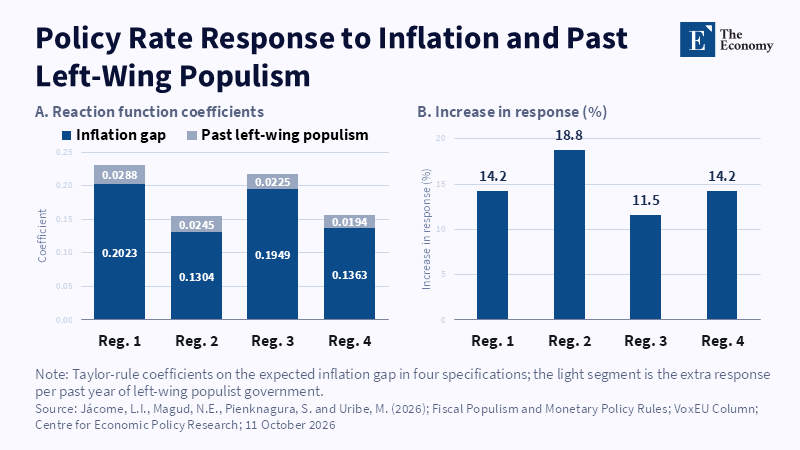
Figure: Each past year of left-wing populism makes today’s central bank react 11.5% to 18.8% harder to the same inflation gap. Related articles:
Read More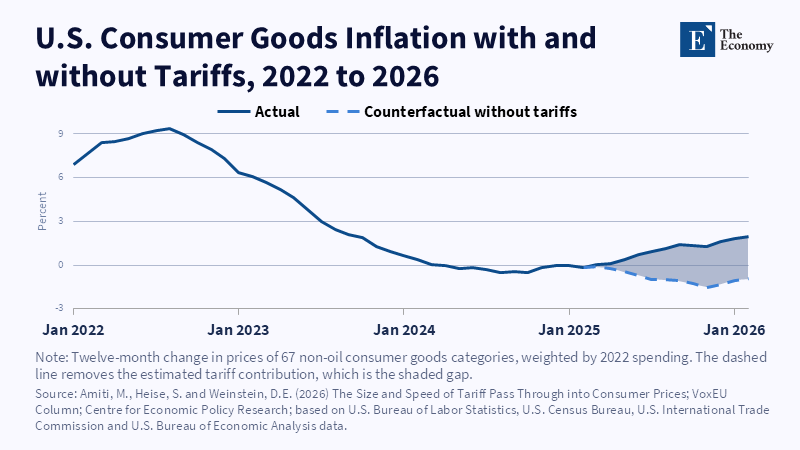
Figure: Tariffs opened a 2.9 point gap by February 2026; without them, goods prices would have been falling. Related articles:
Read More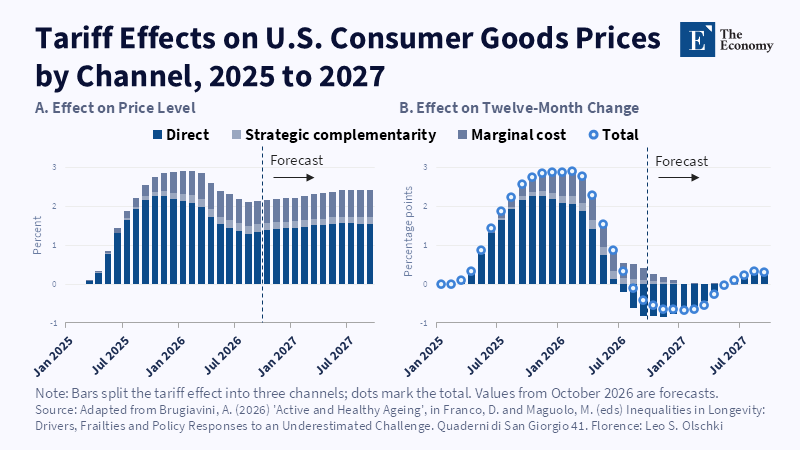
Figure: The inflation push fades to zero by August 2026, but the price level stays about 2% higher. Related articles:
Read More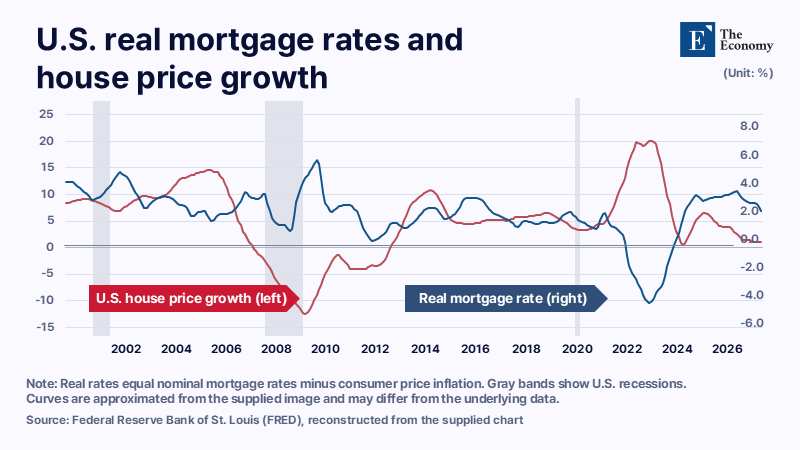








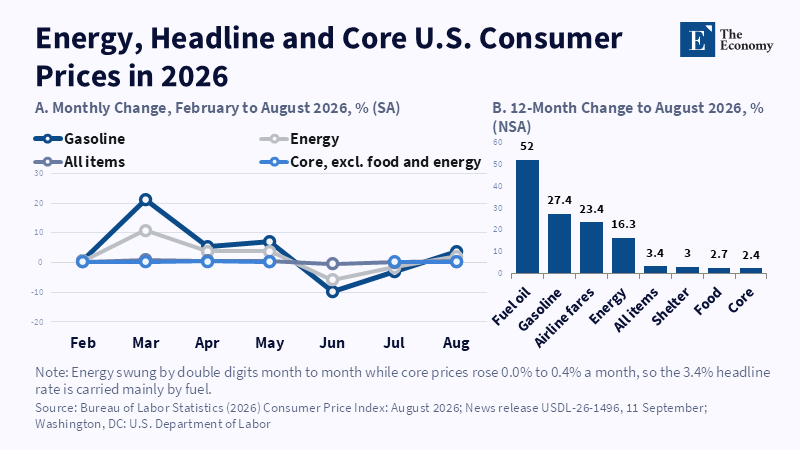
Figure 1: Gasoline jumped 21.2% in March alone while core prices never rose more than 0.4% a month. Related article:
Read More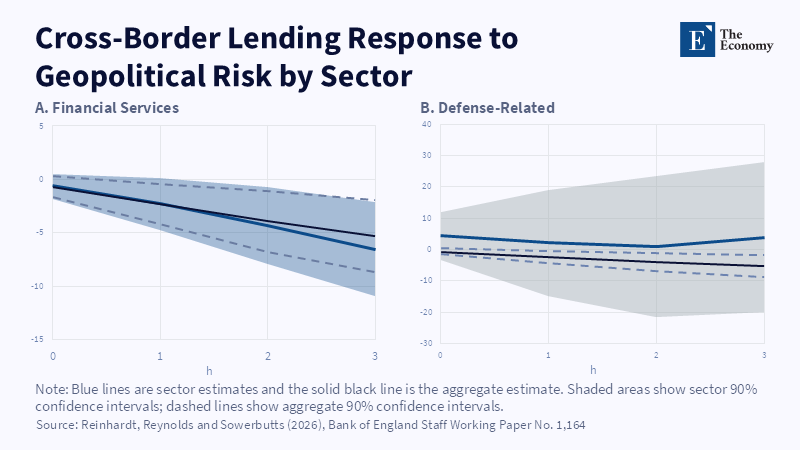
Figure 1: Lending to financial firms keeps falling across the horizon, while defence-related lending shows no clear decline. Related article:
Read More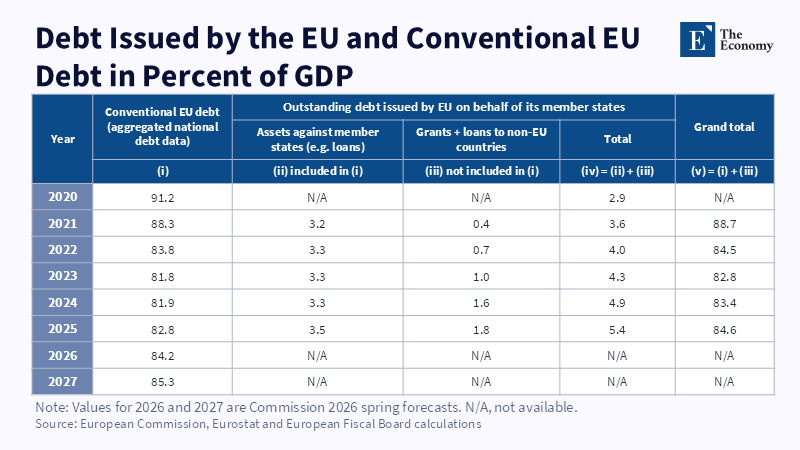
Figure 2: EU-issued debt rose from 2.9 percent to 5.4 percent of GDP between 2020 and 2025, lifting the comprehensive measure 1.8 points above the conventional one.
Read More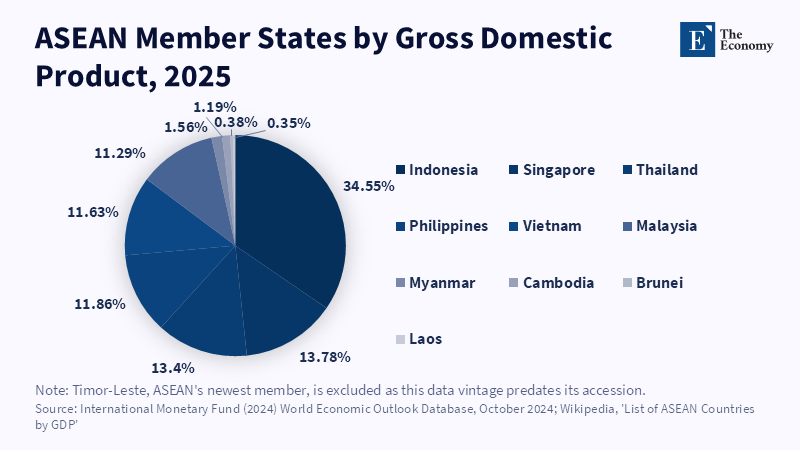
Figure 6. Indonesia’s large share highlights ASEAN’s unequal economic weights.
Read More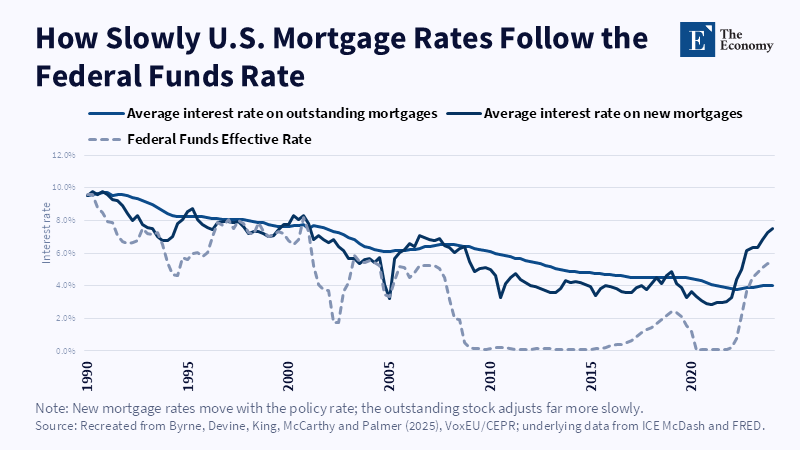
Figure 2: New mortgage rates track the federal funds rate closely; the outstanding stock adjusts far more slowly and with a lag of years. Related article:
Read More
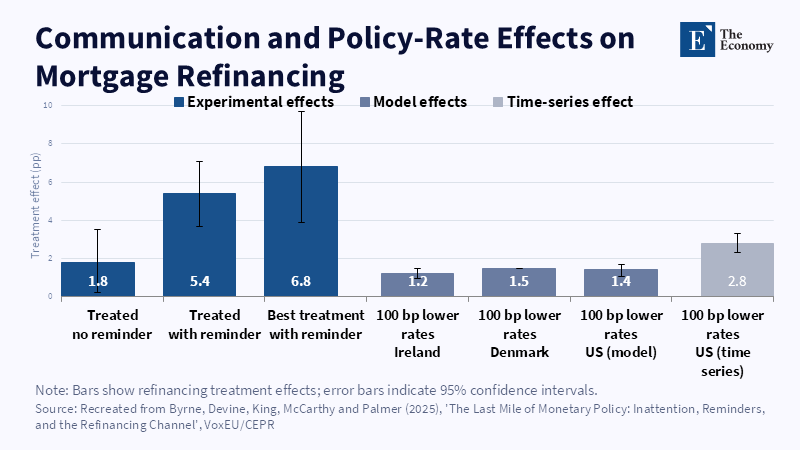
Figure 1: A reminder letter more than tripled the base treatment effect, rivalling the pull of a full percentage-point rate cut in comparable markets.
Read More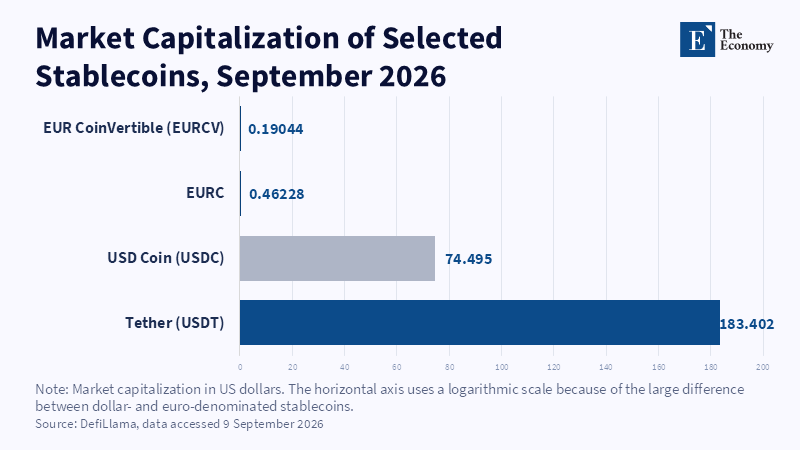
Figure 1: Even after MiCA's compliance boost, dollar-pegged stablecoins outweigh their euro counterparts by roughly 400 to 1. Related article:
Read More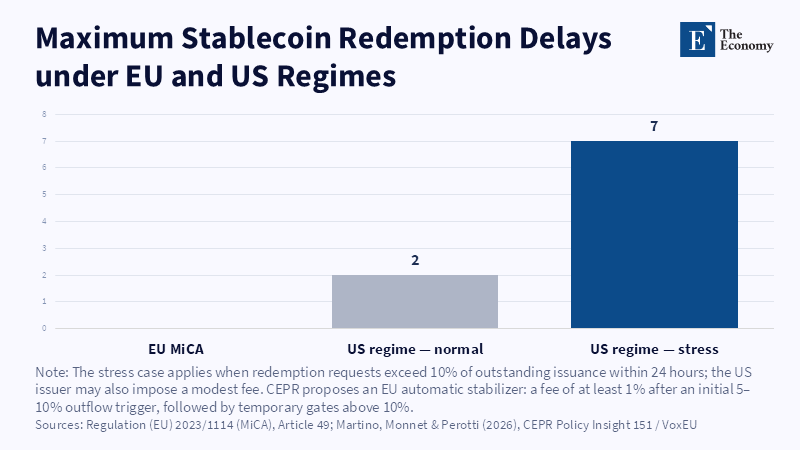
Figure 2: MiCA's redemption promise leaves the EU issuer as the only fixed point when outflows accelerate. Related article:
Read More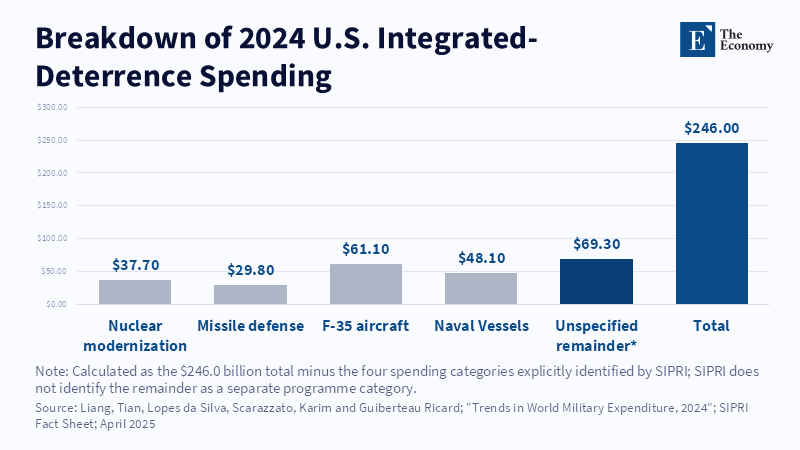
Figure 3. Less than a sixth of this budget funds nuclear modernization itself; the rest buys aircraft, ships, and missile defense.
Read More
Figure 1: A reminder letter more than tripled the base treatment effect, rivalling the pull of a full percentage-point rate cut in comparable markets. Related article:
Read More
Figure 1: Even after MiCA's compliance boost, dollar-pegged stablecoins outweigh their euro counterparts by roughly 400 to 1. Related article:
Read More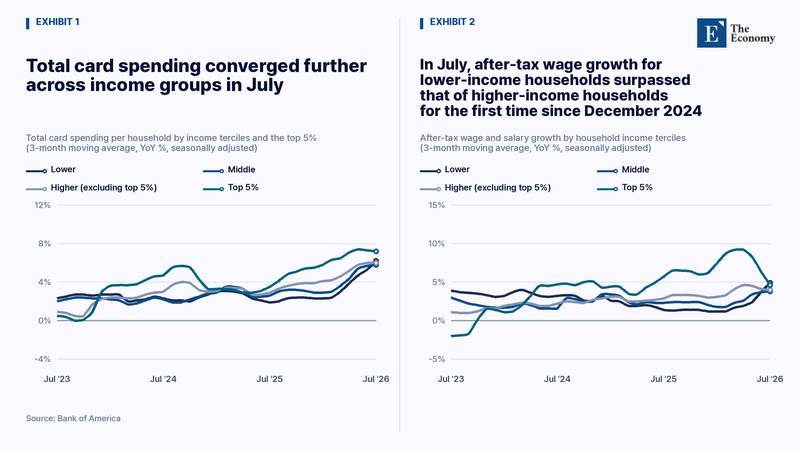
Note: In July, lower-income households’ after-tax wage growth surpassed that of higher-income households for the first time since December 2024, further narrowing the gap in card-spending growth. Related Articles:
Read More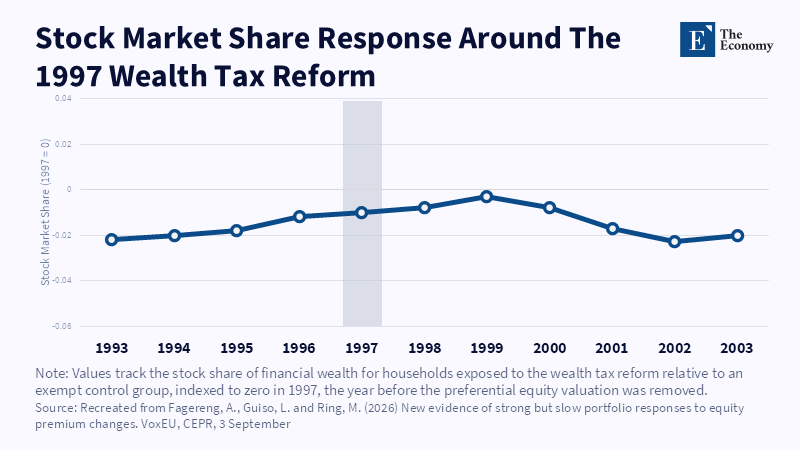
Figure 2: Affected households' stock share peaks in 1997, then drifts down over several years. Related article:
Read More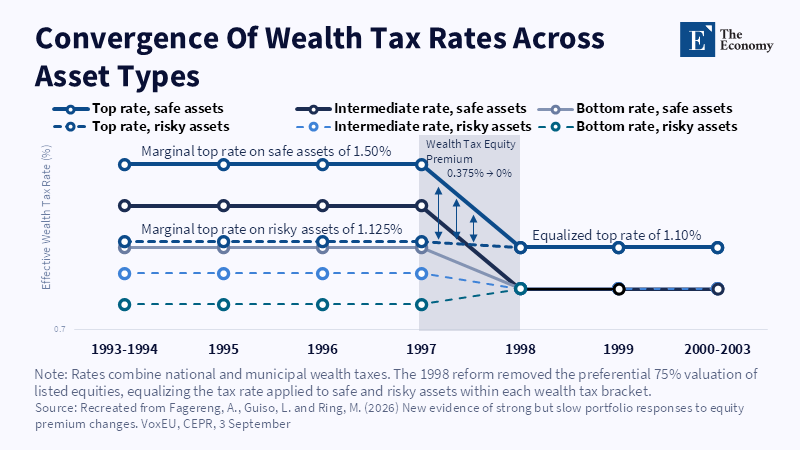
Figure 1: Wealth tax rates on safe and risky assets converge after the 1998 reform removed the valuation gap. Related article:
Read More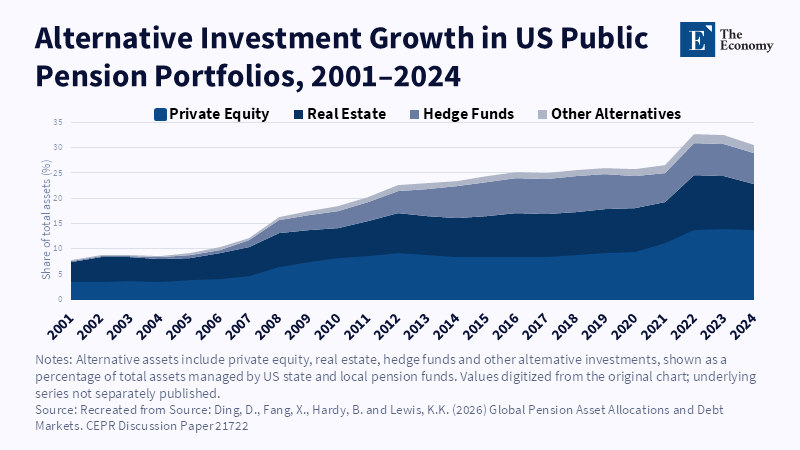
Figure 2: Alternative assets in US state and local pension portfolios have more than tripled since 2001, with the sharpest rise since 2021. Related article:
Read More