
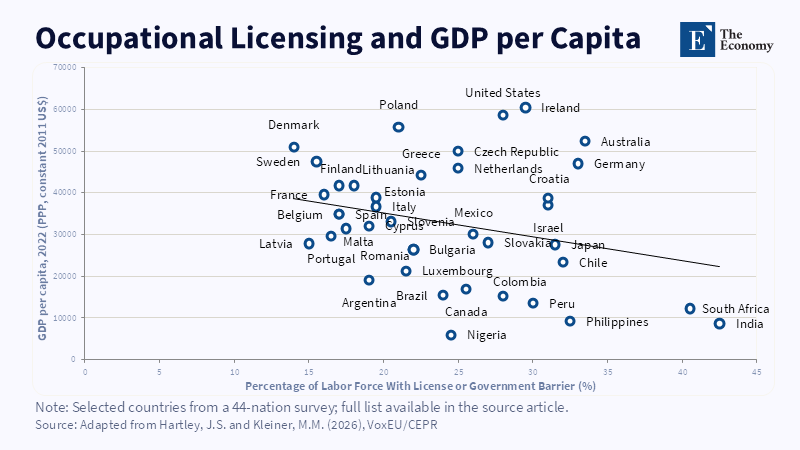
Countries with heavier licensing tend to have lower income per person, although the relationship is descriptive rather than causal. Related Articles:
Read More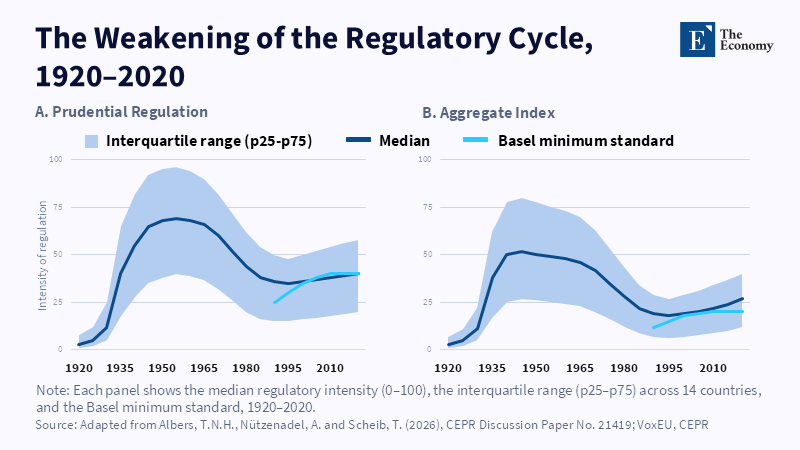
Regulation strengthened far less after 2008 than after earlier financial crises. Related Articles: When Euro Banks Fail: The Case for Cross-Border Banki
Read More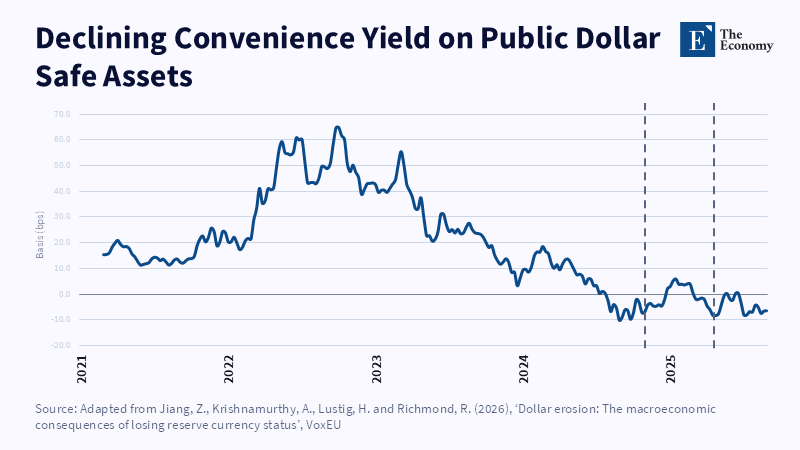
The convenience yield on US public safe assets has fallen sharply and remained near or below zero since late 2024. Related Articles: The Dolla
Read More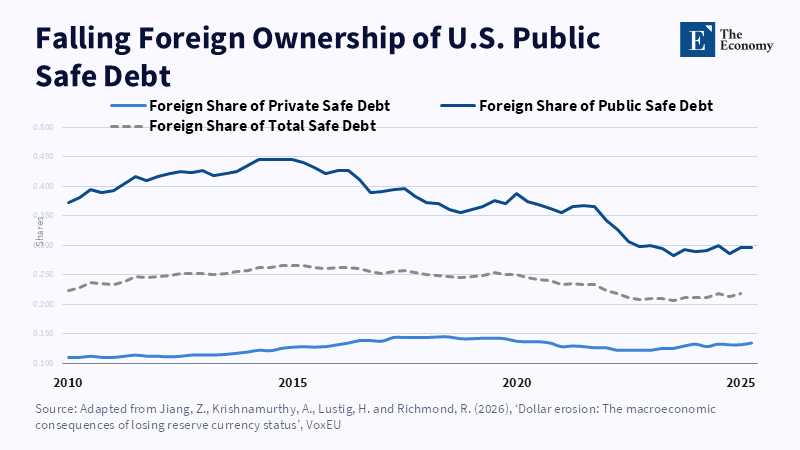
Foreign ownership of US public safe debt has fallen from roughly 45% to around 30%, while foreign ownership of private safe debt has remained broadly stable. Related Articles:
Read More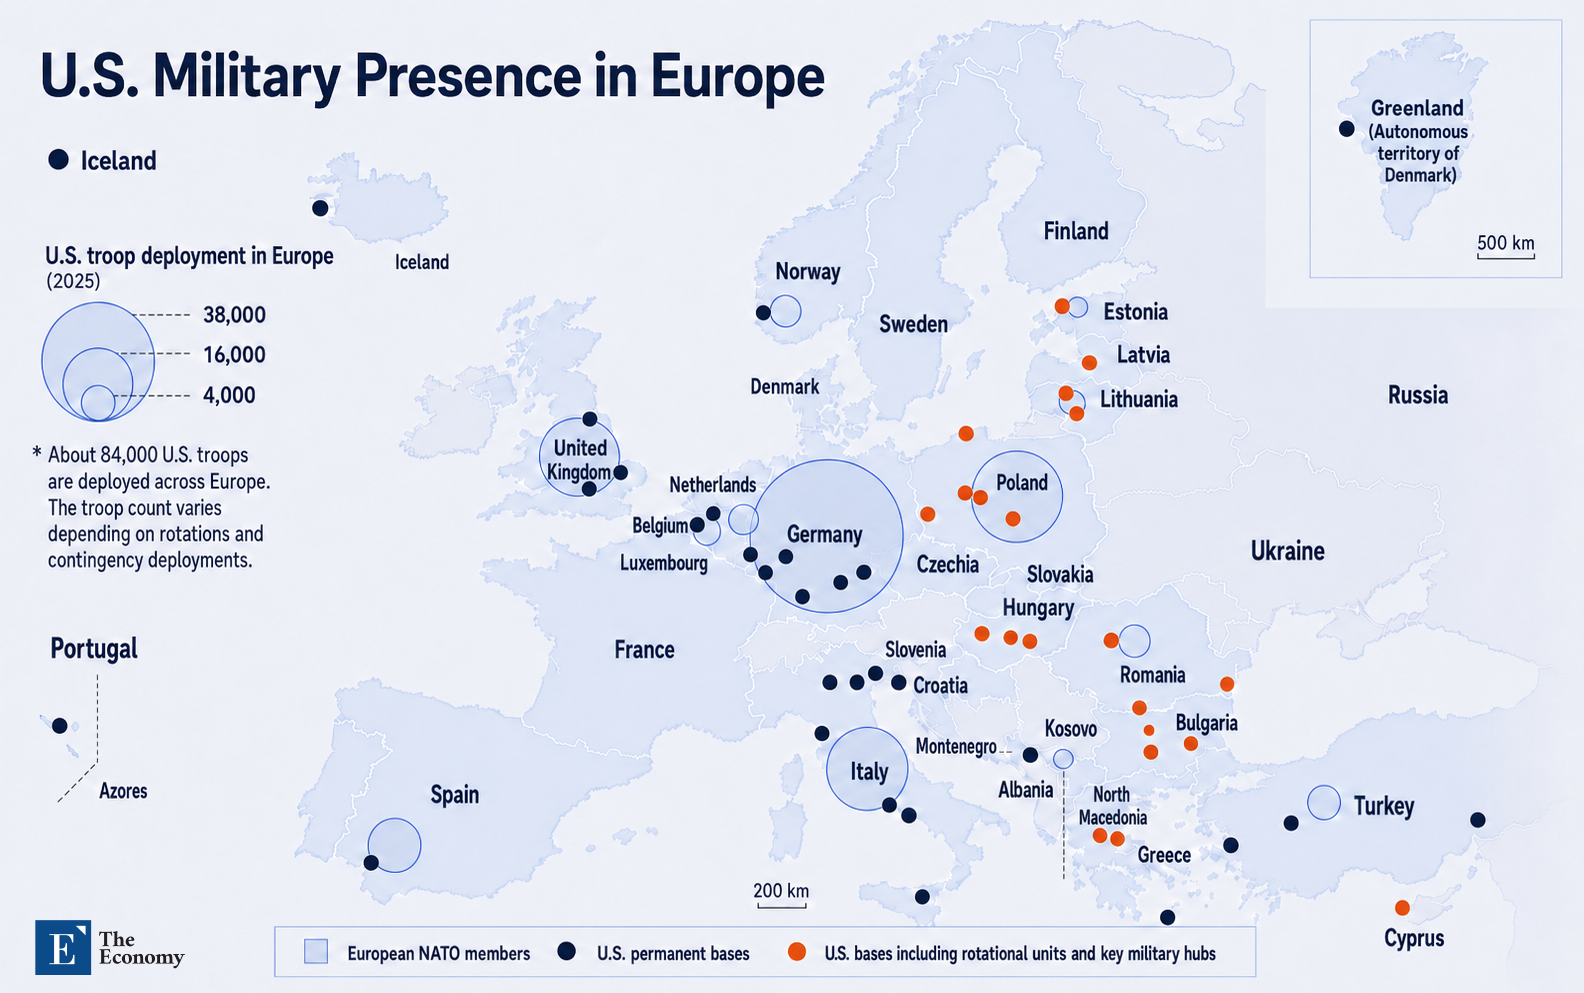
Source: North Atlantic Treaty Organization (NATO) Related Articles: “Europe Must Defend Europe”: U.S.
Read More







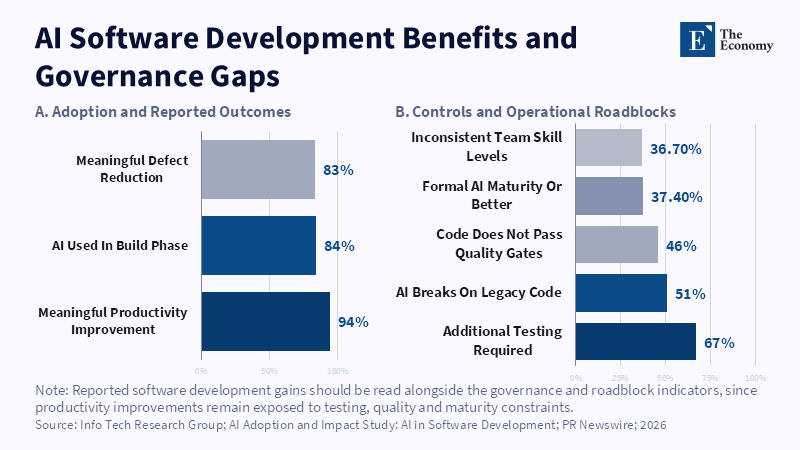
AI productivity has expanded faster than the testing, skills and governance needed to control it. Related Articles: Cognitive Outsourcing at Work: Why AI
Read More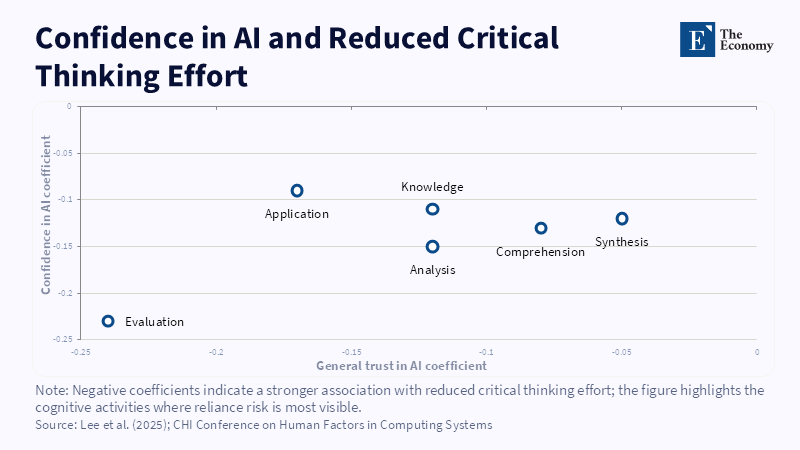
Evaluation is the main risk point, where greater trust in AI is associated with less critical scrutiny. Related Articles: Cognitive Outsourcing at Work: W
Read More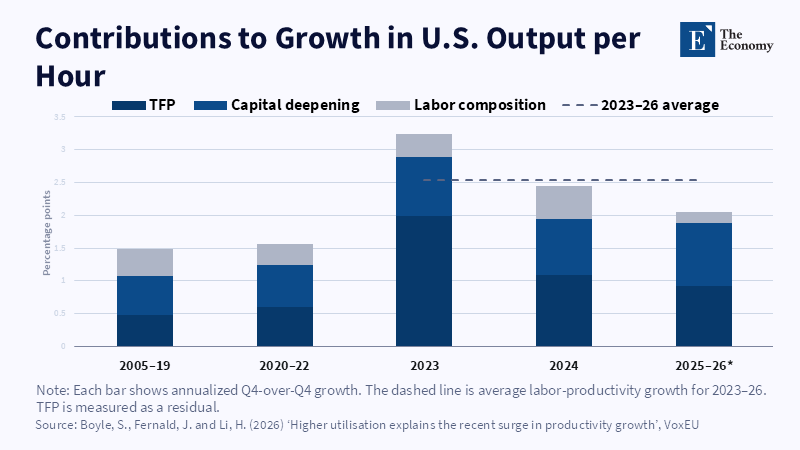
The post-2022 acceleration is concentrated in TFP, while capital deepening and labour composition contribute much less. Related Articles: The Cost Rese
Read More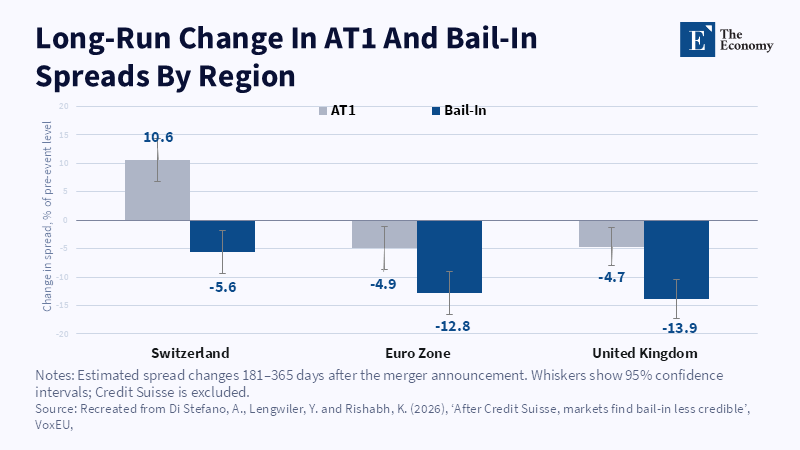
Bail-in spreads fell across all three regions, indicating that investors viewed future bail-in as less likely after Credit Suisse. Related Articles:
Read More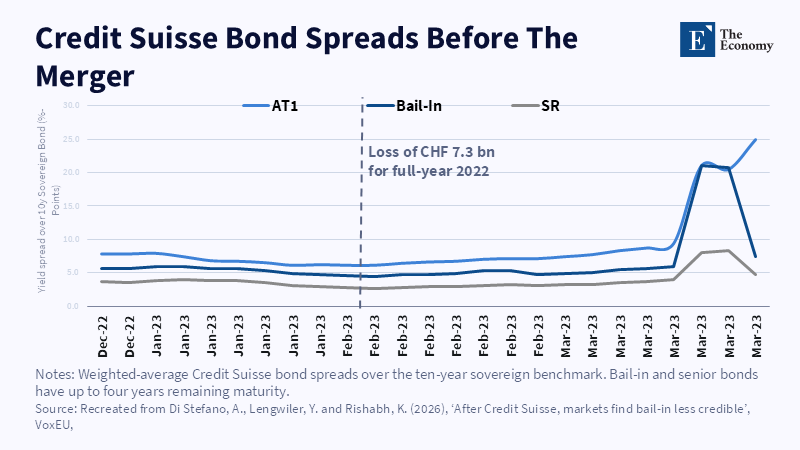
AT1 and bail-in spreads rose together before the merger, showing that investors expected both creditor layers to absorb losses. Related Articles: The
Read More
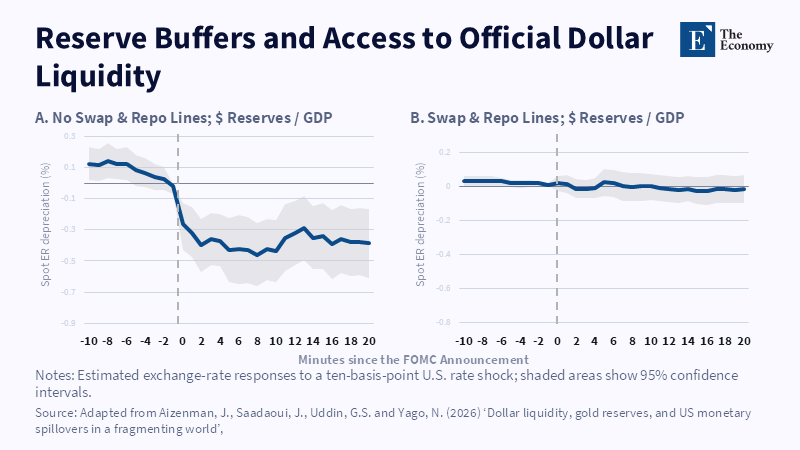
Note: Dollar reserves blunt Fed shocks mainly where countries lack official swap or repo access. Related article: Gold Cannot Stop a Dollar Run: Why Dollar S
Read More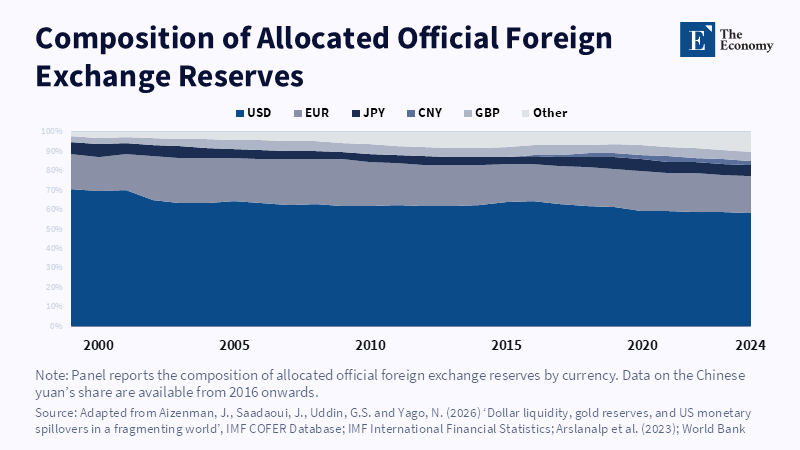
Note: The dollar still dominates official reserves, even as reserve managers diversify around the edges. Related article: Gold Cannot Stop a Dollar Run: Why D
Read More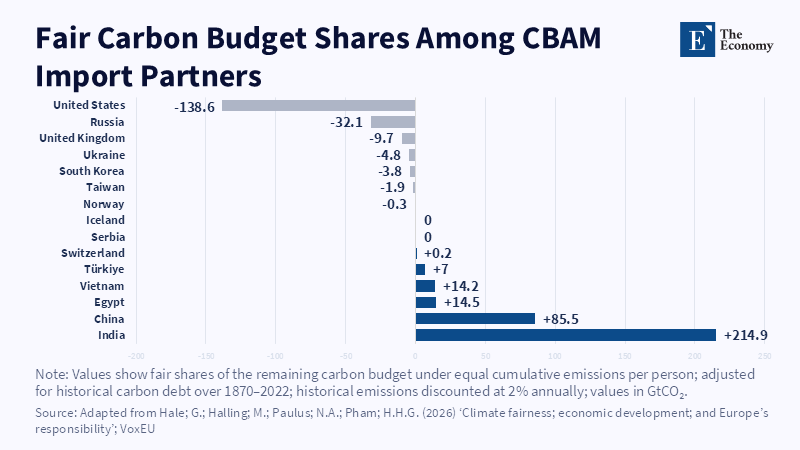
Note: India and China still hold positive carbon-budget claims, while the United States and several advanced economies are already in carbon debt Related article:
Read More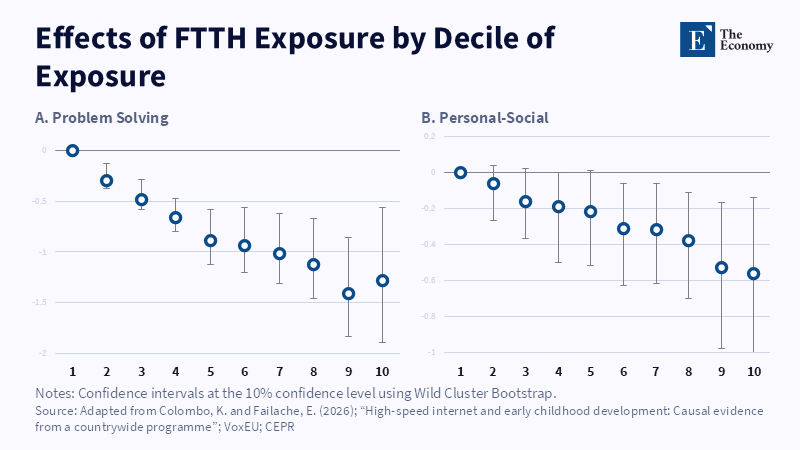
Note: Problem-solving and personal-social losses generally deepen as cumulative FTTH exposure rises. Related article: The Broadband Problem Is an Atte
Read More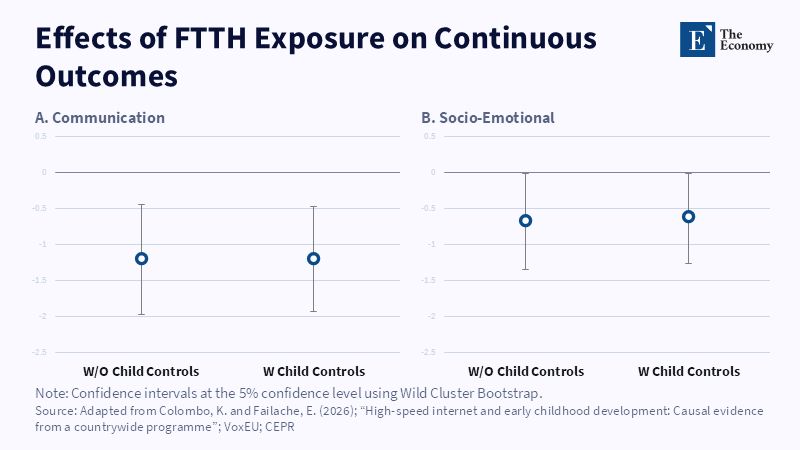
Note: FTTH exposure reduced communication and socio-emotional scores, with little change after child controls were added. Related article: The Broadban
Read More
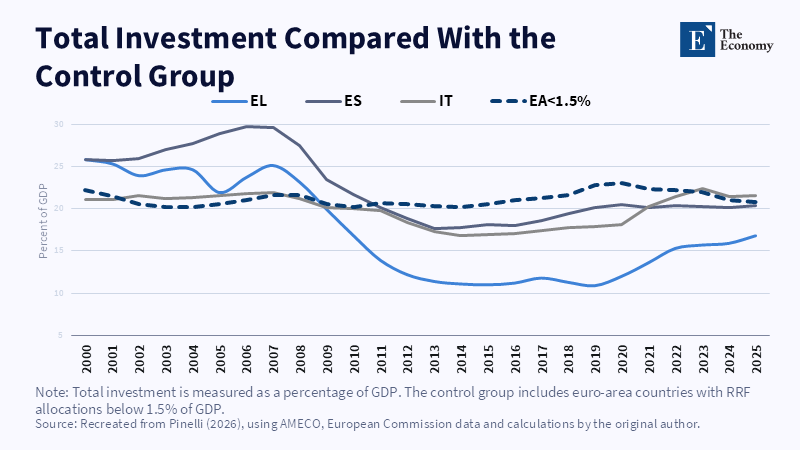
Note: Greece and Italy posted the largest rises in investment shares, while Spain’s increase was modest. Related article:
Read More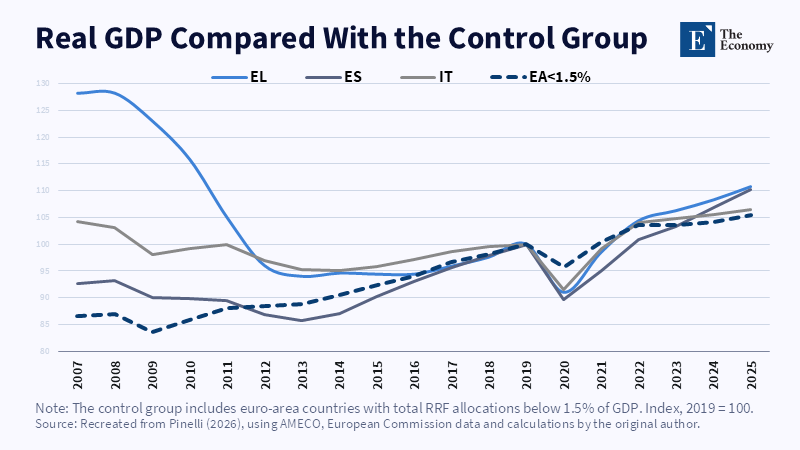
Note: Greece and Spain recorded the strongest output gains, while all three countries outperformed the low-allocation group. Related article:
Read More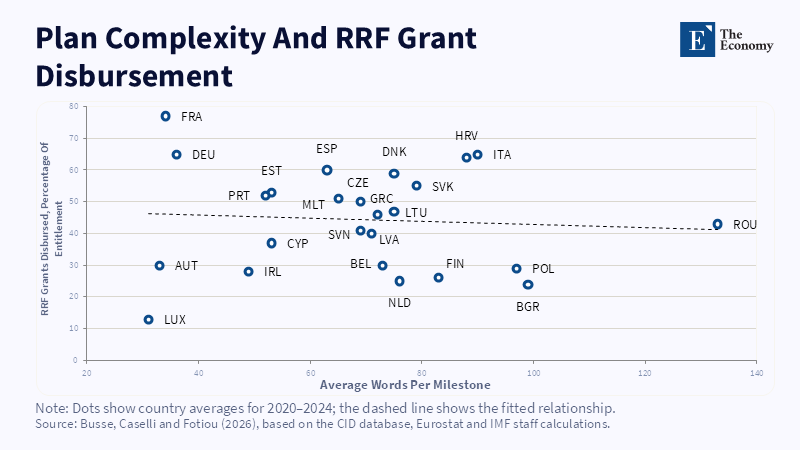
Note: More complex national plans were generally associated with slower grant disbursement. Related article: [Europ
Read More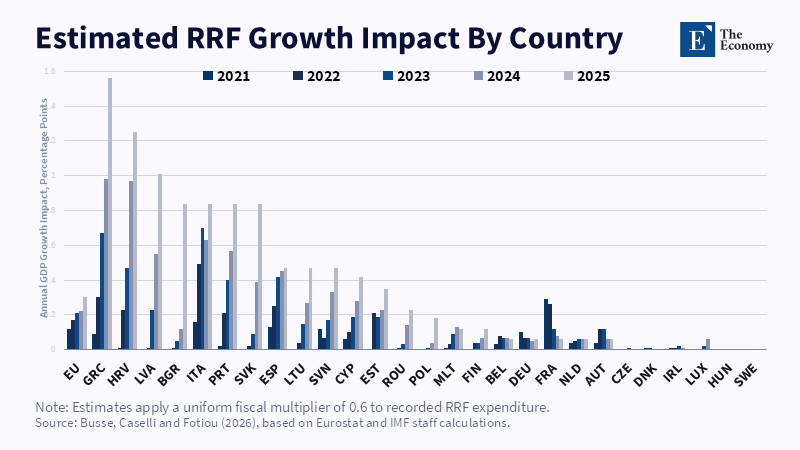
Note: The estimated growth impulse was largest in countries with the biggest RRF programmes. Related article: [Europ
Read More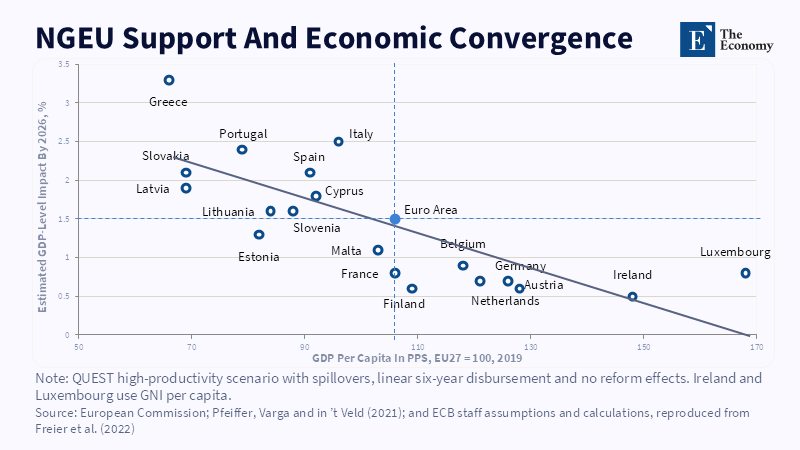
Note: Lower-income economies were expected to receive the largest GDP gains from NGEU. Related article: [Europe’s Fisc
Read More