Industry
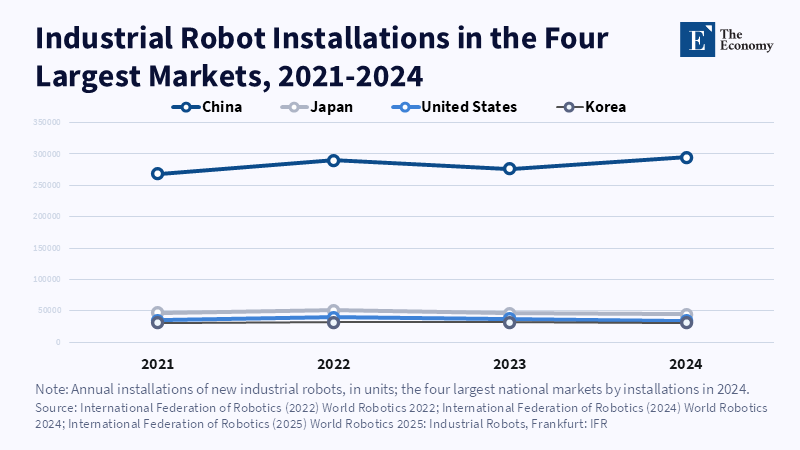
Figure: China installs more robots every year than Japan, the US and Korea combined. Related articles:
Read More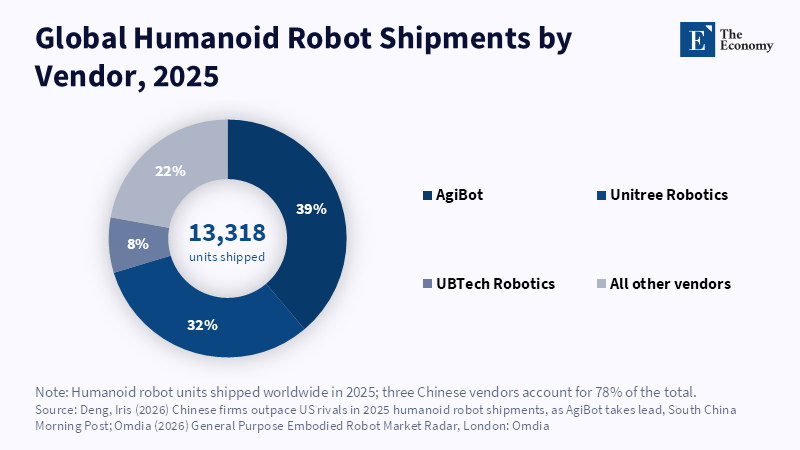
Figure: Three Chinese vendors shipped 78 percent of the world’s humanoid robots in 2025. Related articles:
Read More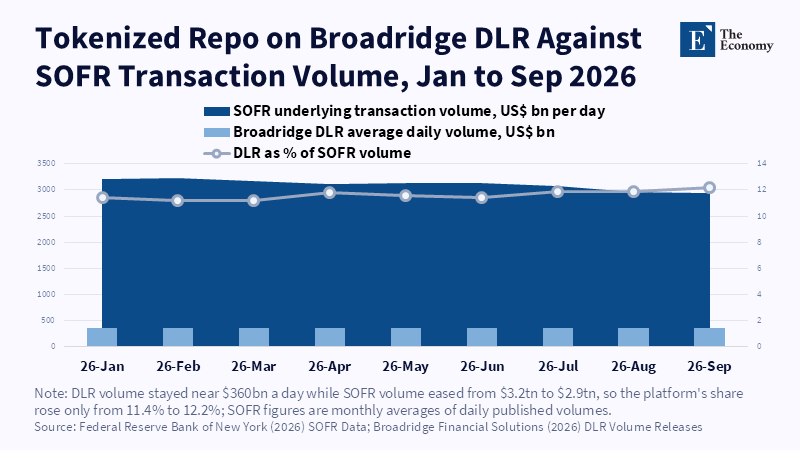
Figure: The largest tokenized repo platform handles just over a tenth of SOFR volume. Related articles:
Read More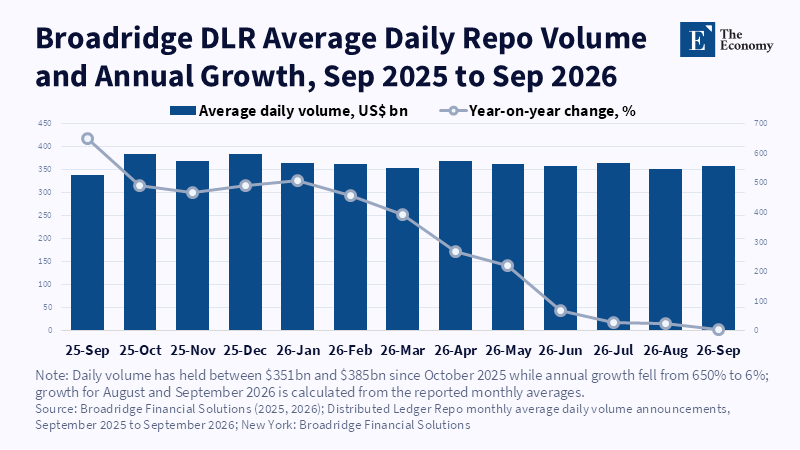
Figure: Volume plateaued near $360bn a day as annual growth fell from 650 percent to 6 percent. Related articles:
Read More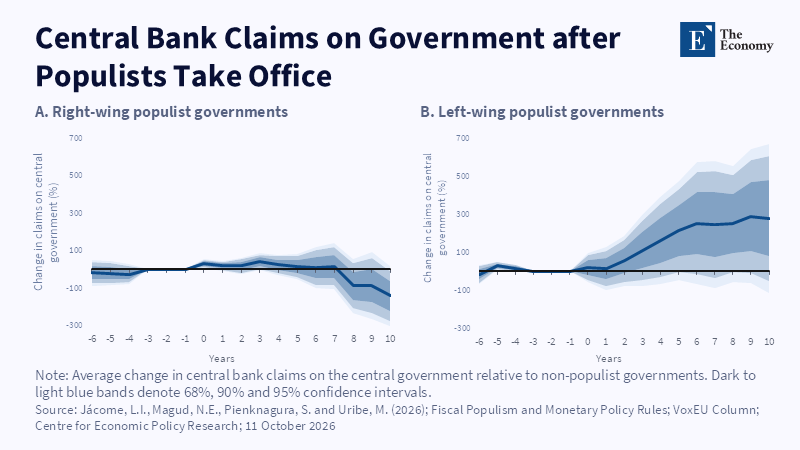
Figure: A decade after left-wing populists take office, central bank claims on the state are up close to 300%, while right-wing governments leave no lasting rise. Related articles:
Read More






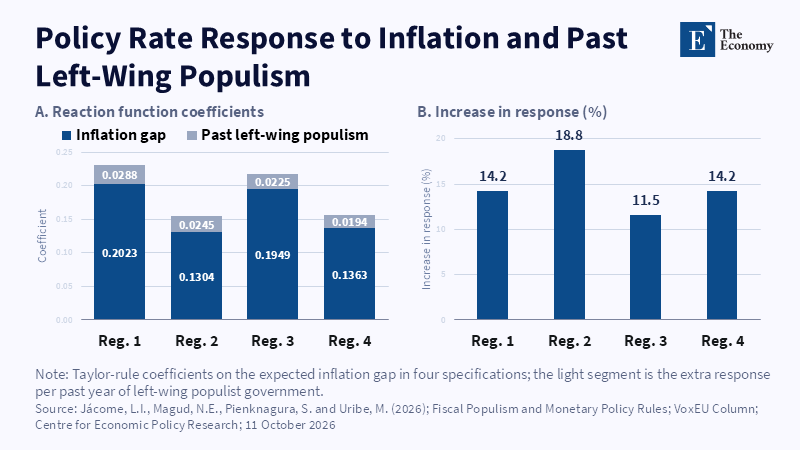
Figure: Each past year of left-wing populism makes today’s central bank react 11.5% to 18.8% harder to the same inflation gap. Related articles:
Read More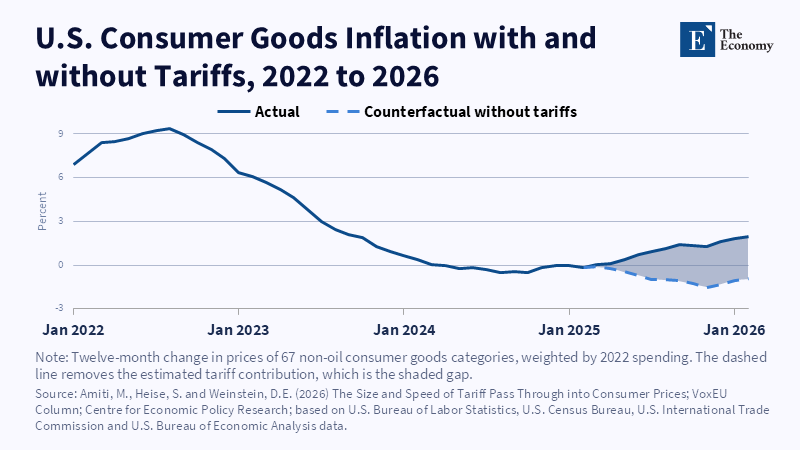
Figure: Tariffs opened a 2.9 point gap by February 2026; without them, goods prices would have been falling. Related articles:
Read More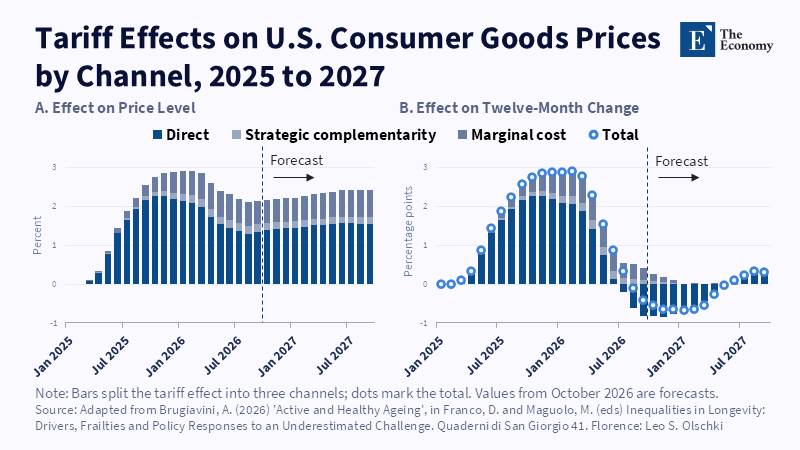
Figure: The inflation push fades to zero by August 2026, but the price level stays about 2% higher. Related articles:
Read More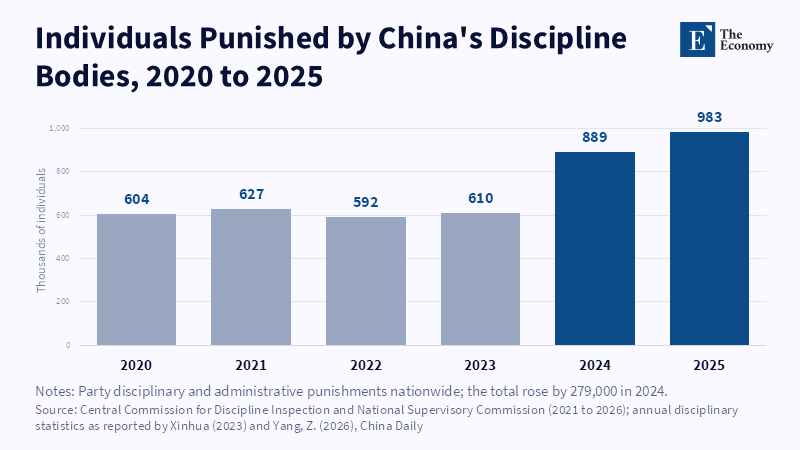
Figure: Punishments held near 600,000 for four years, then jumped 46 percent in 2024, the same year Beijing reopened channels to Hong Kong. Related articles:
Read More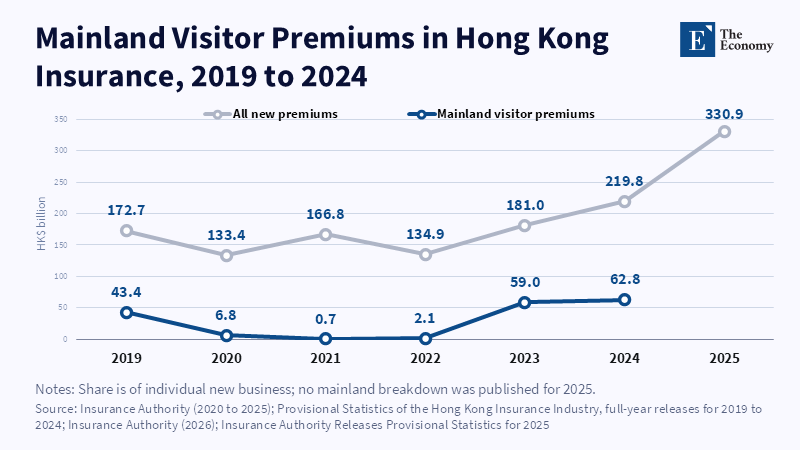
Figure 1: Mainland buyers came back to a third of new sales once the border reopened.
Read More
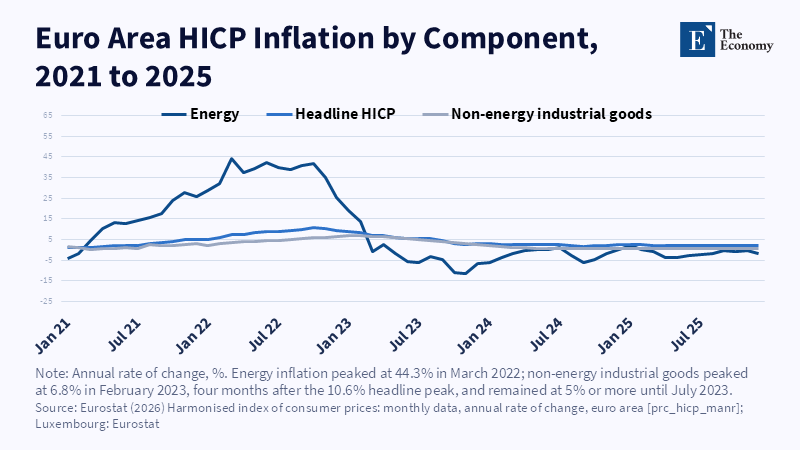
Figure: Energy inflation peaked in March 2022, but manufactured goods prices kept rising until February 2023, as the gas shock worked its way through factory costs. Related articles:
Read More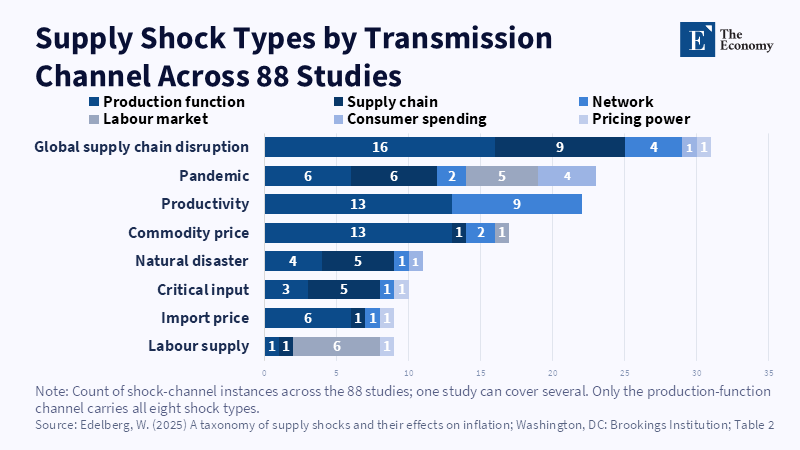
Figure: Commodity price shocks reach prices almost entirely through production costs, while supply chain and pandemic shocks spread across five channels at once. Related articles:
Read More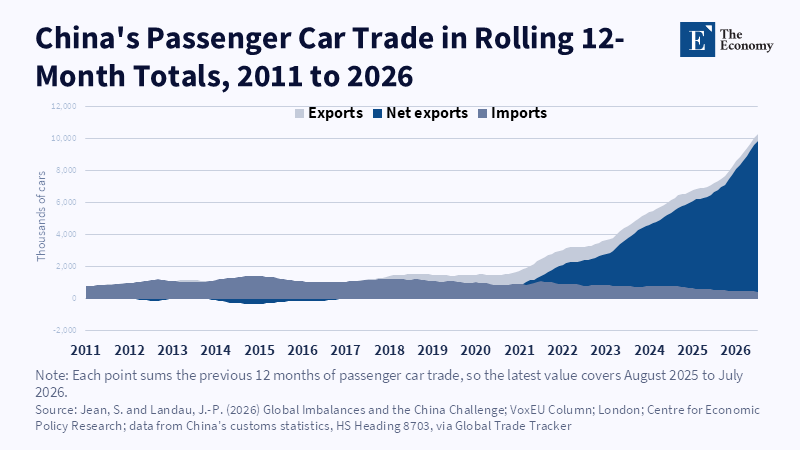
Figure: China imported more cars than it exported until 2017.
Read More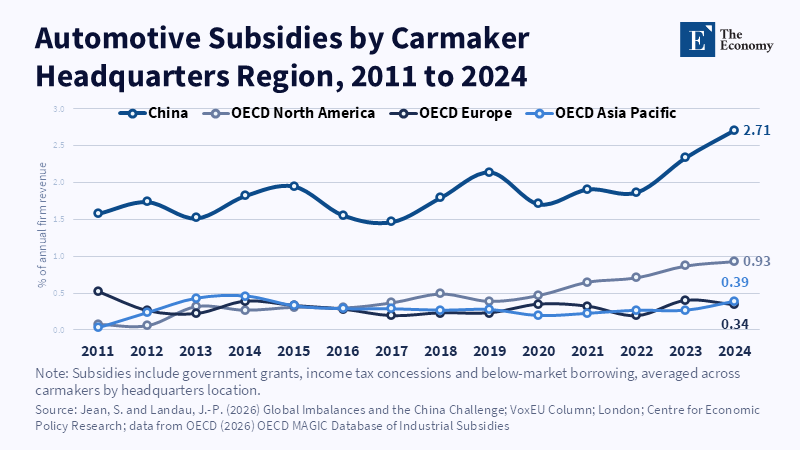
Figure: Chinese carmakers received subsidies worth 2.7 percent of revenue in 2024, nearly three times the North American rate and about seven times Europe’s. Related articles:
Read More
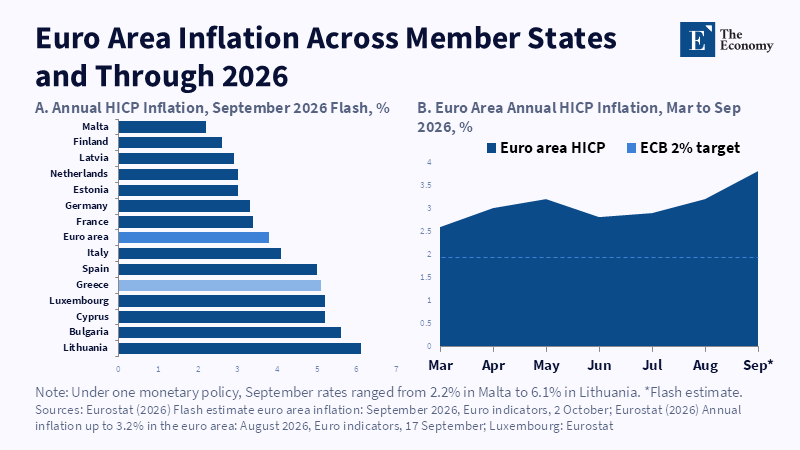
Related article: Geopolitical Shocks and Inflation: The Magnitude of the Crisis Determines the Price Path
Read More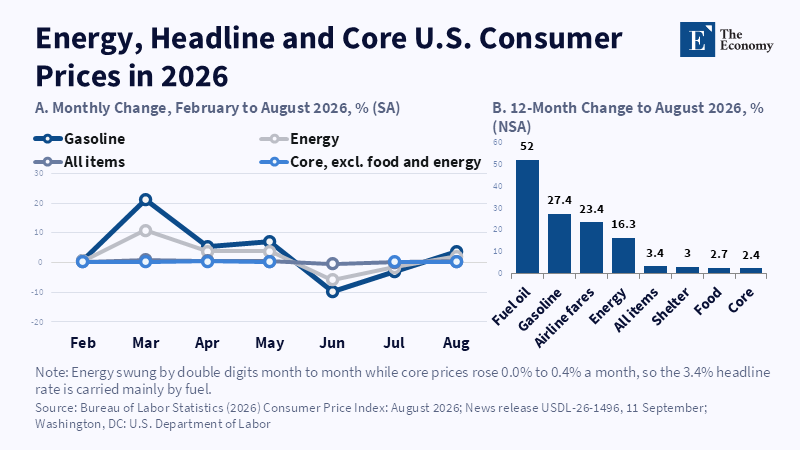
Figure 1: Gasoline jumped 21.2% in March alone while core prices never rose more than 0.4% a month. Related article:
Read More
Related articles: U.S.
Read More