Industry
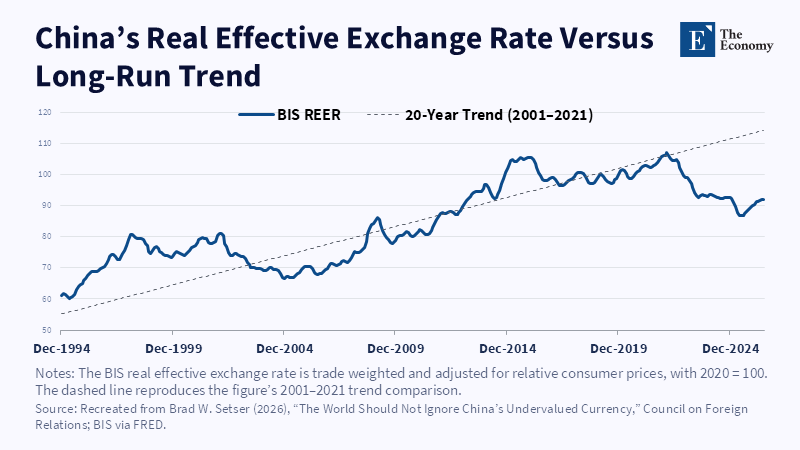
Figure 1: China’s real exchange rate remains well below its long-run trend. Related article:
Read More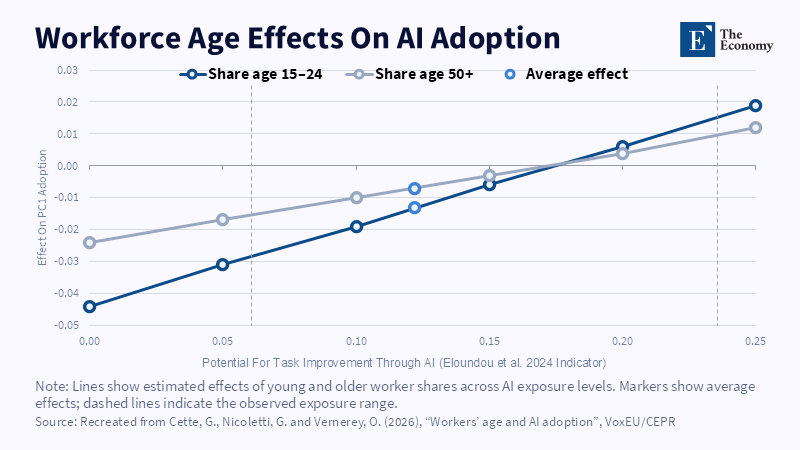
Figure 1: Higher AI exposure changes how workforce age relates to adoption. Related article:
Read More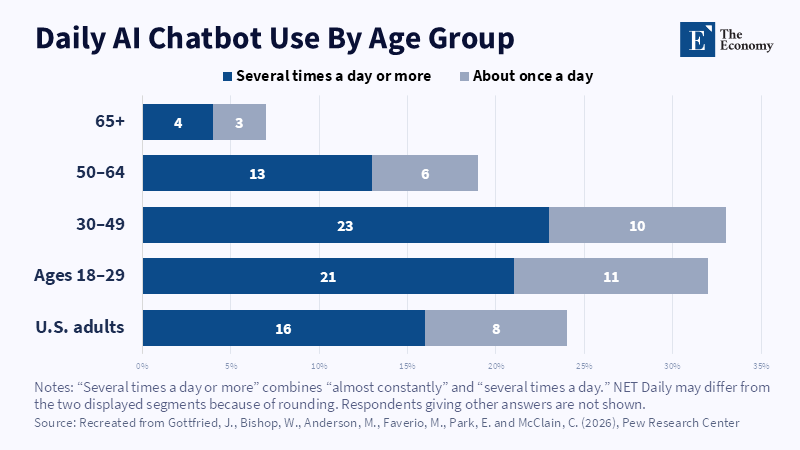
Figure 2: Daily chatbot use is highest among younger working-age adults. Related article: Age and AI Adoption:
Read More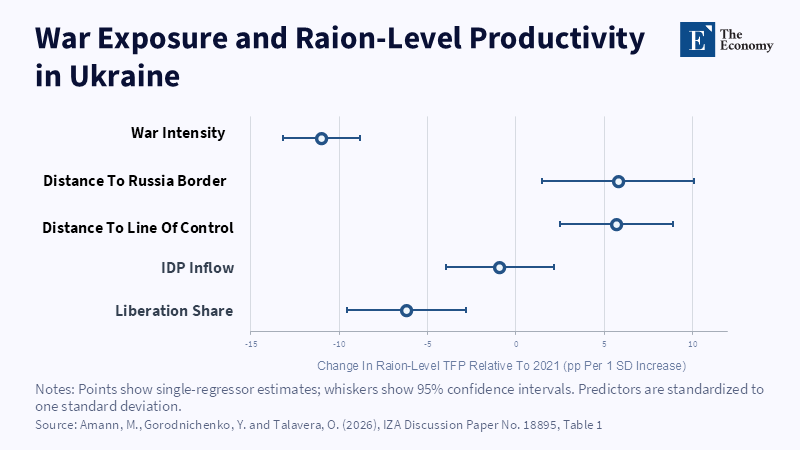
Figure 2: Local productivity losses track attack intensity more than distance. Related article:
Read More








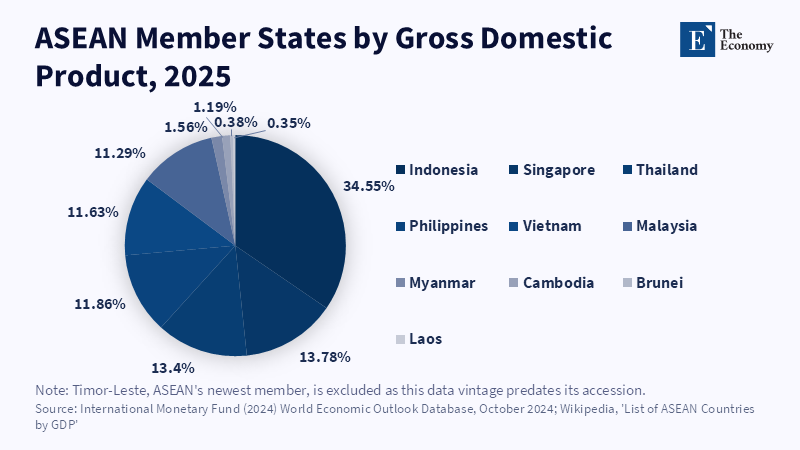
Figure 6. Indonesia’s large share highlights ASEAN’s unequal economic weights.
Read More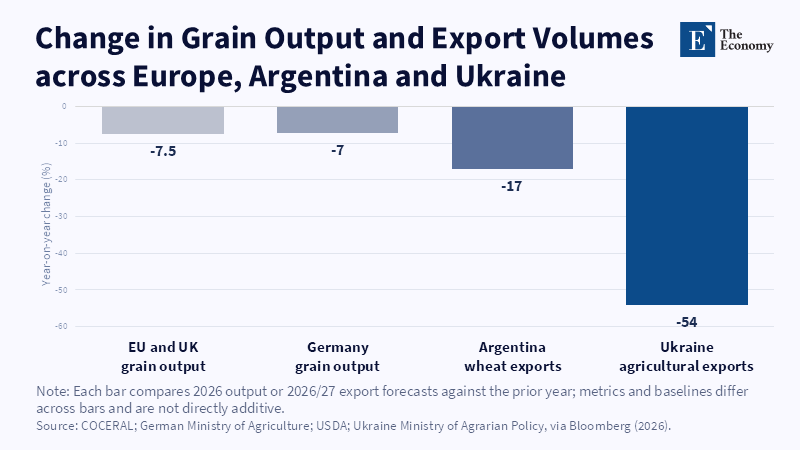
Figure 2: Three exporters' supply retreats at once, not one at a time. Related article: Grain Prices in E
Read More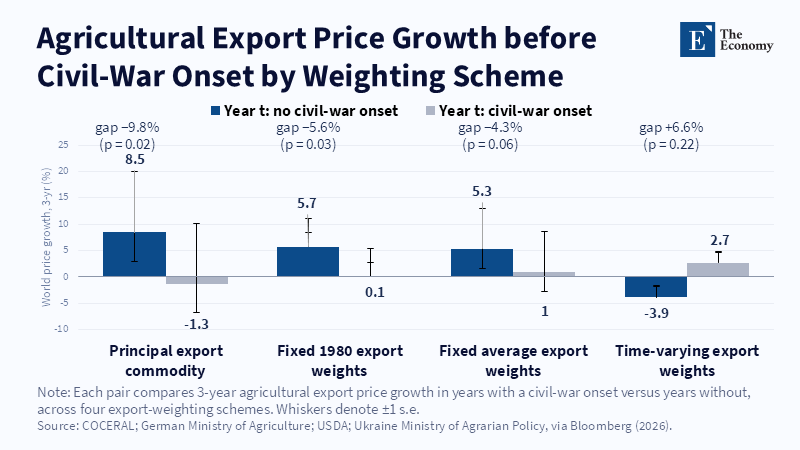
Figure 1: Prices tend to rise before peaceful years and stall or reverse before conflict. Related article: G
Read More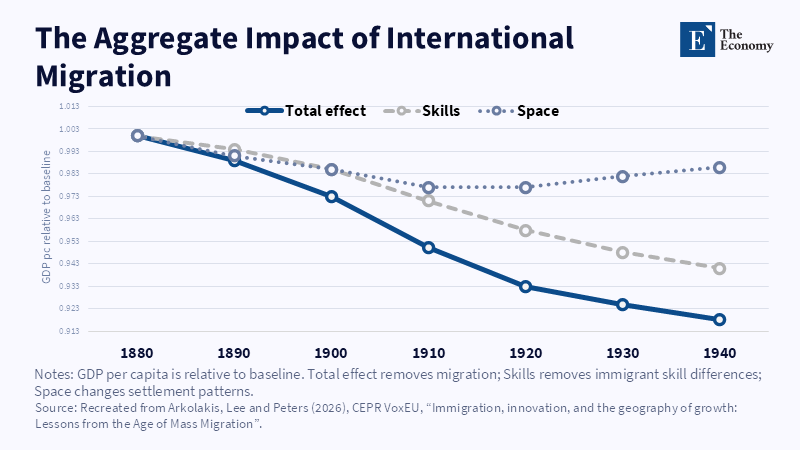
Figure 2: Skills account for most of the modeled GDP effect. Related article: Migration and Econom
Read More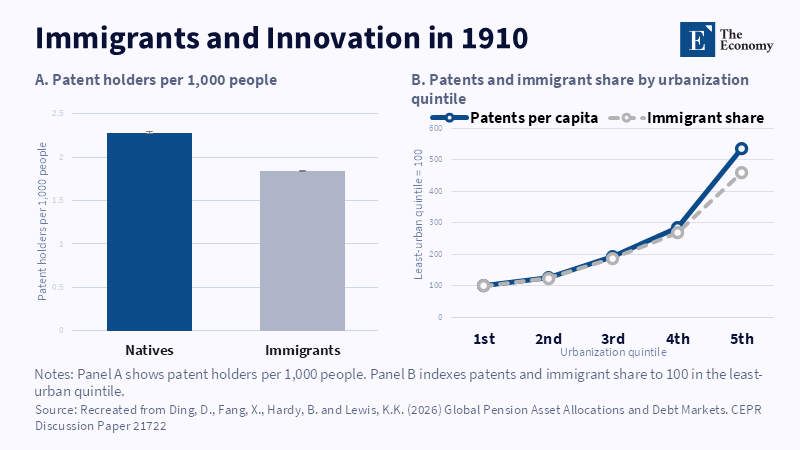
Figure 1: Patenting and immigrant concentration rose with urbanisation. Related article: Migration an
Read More
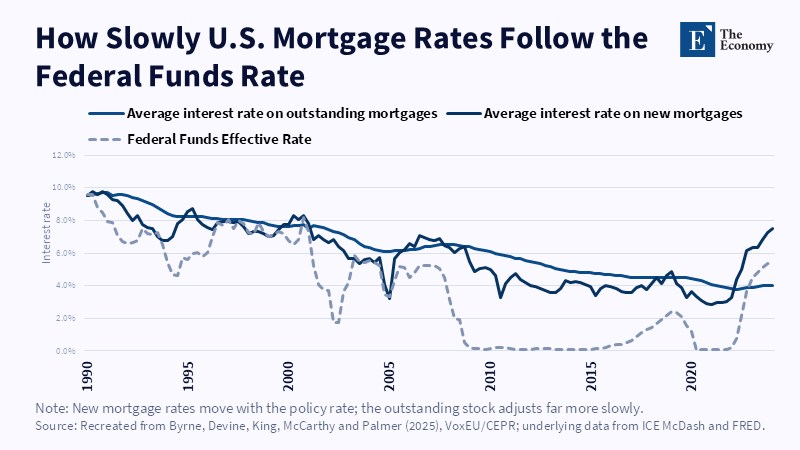
Figure 2: New mortgage rates track the federal funds rate closely; the outstanding stock adjusts far more slowly and with a lag of years. Related article:
Read More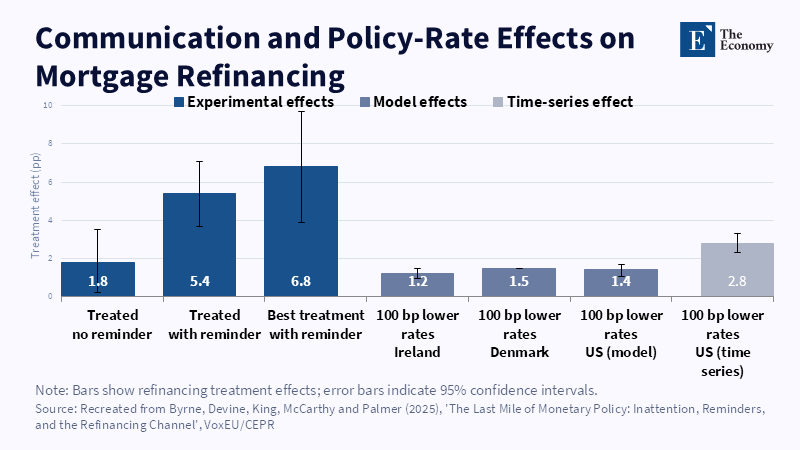
Figure 1: A reminder letter more than tripled the base treatment effect, rivalling the pull of a full percentage-point rate cut in comparable markets.
Read More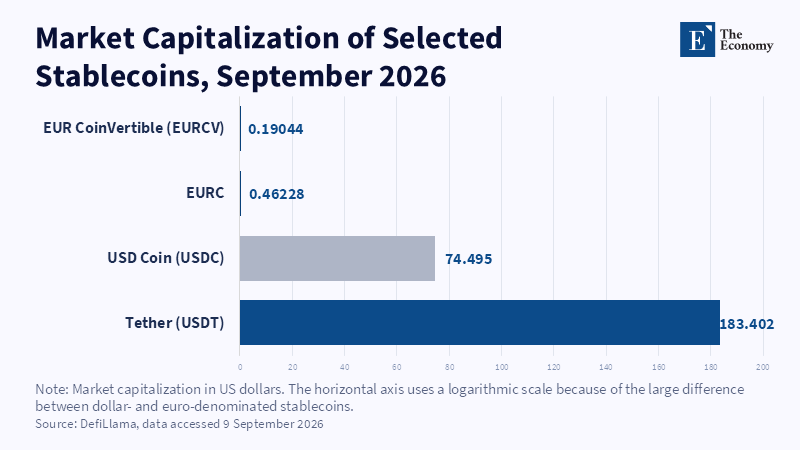
Figure 1: Even after MiCA's compliance boost, dollar-pegged stablecoins outweigh their euro counterparts by roughly 400 to 1. Related article:
Read More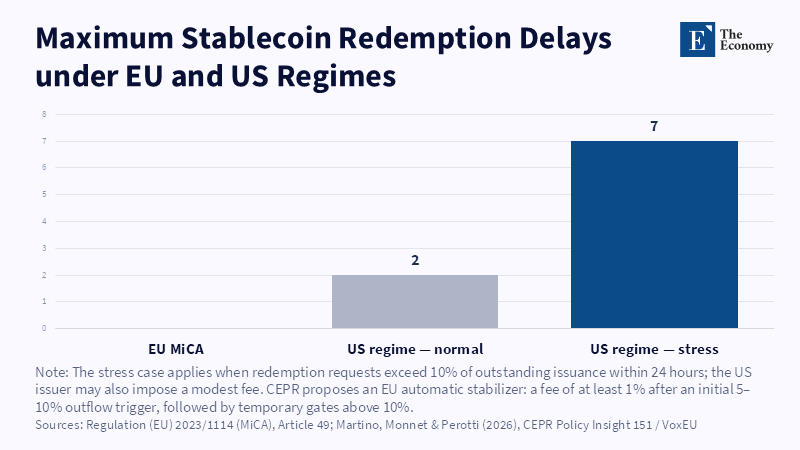
Figure 2: MiCA's redemption promise leaves the EU issuer as the only fixed point when outflows accelerate. Related article:
Read More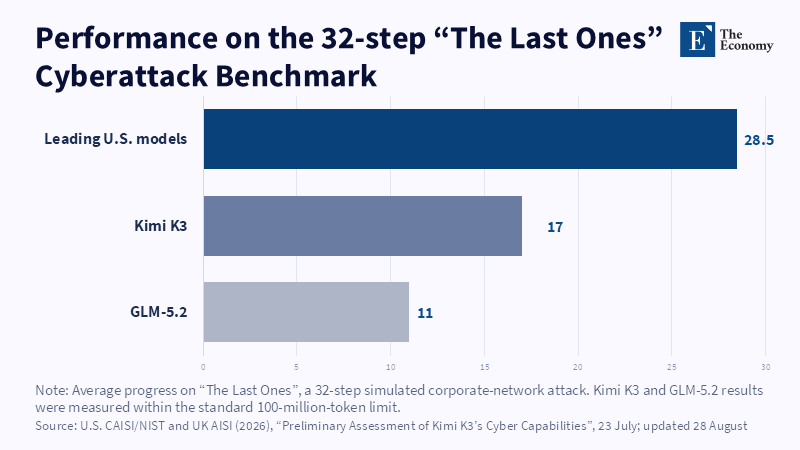
Figure 1: On a 32-step simulated attack, Kimi K3 completed barely six of every ten steps the leading US models did. Related article:
Read More
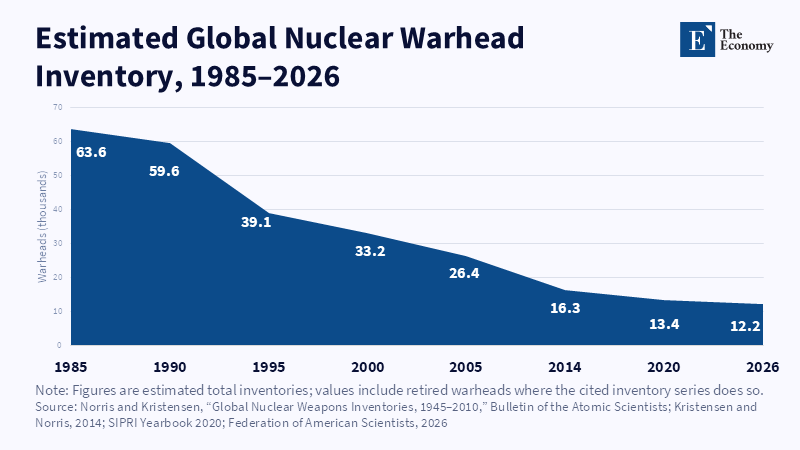
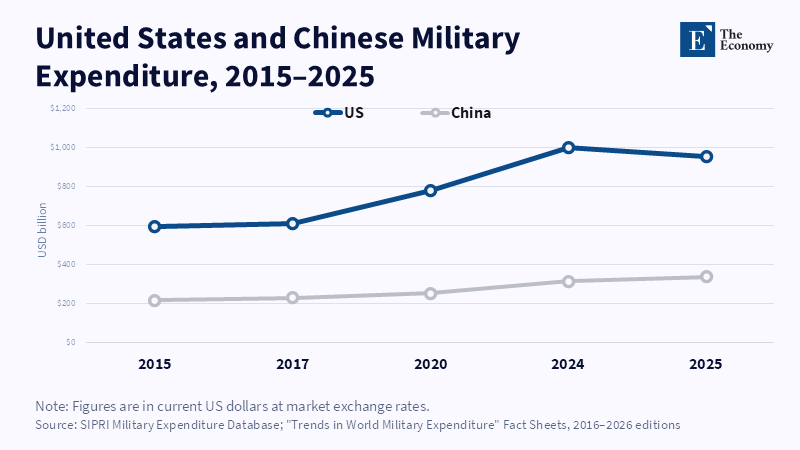
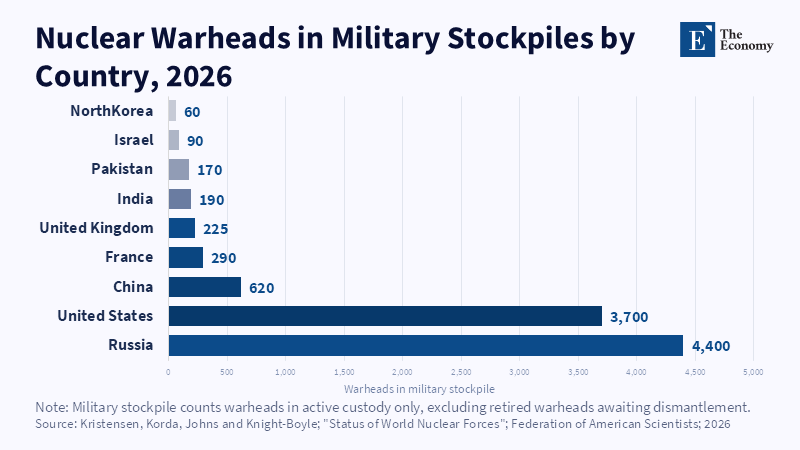
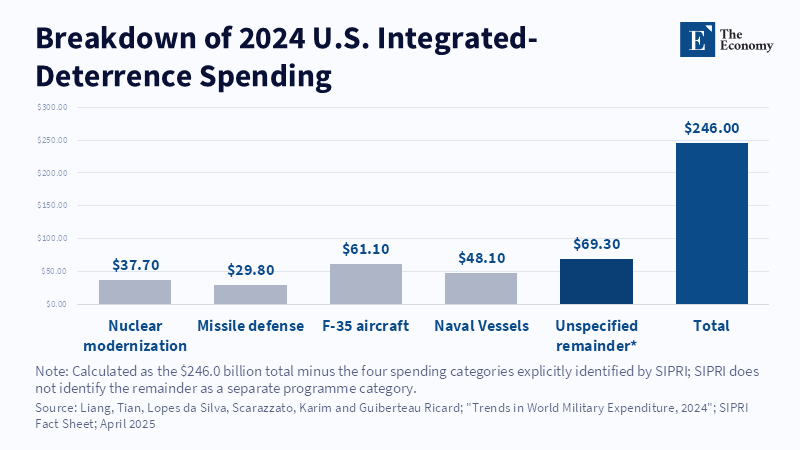
Figure 3. Less than a sixth of this budget funds nuclear modernization itself; the rest buys aircraft, ships, and missile defense.
Read More