Industry
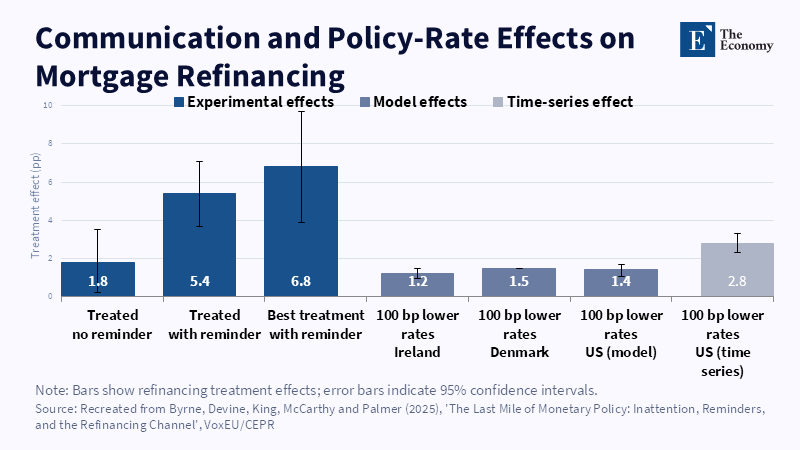
Figure 1: A reminder letter more than tripled the base treatment effect, rivalling the pull of a full percentage-point rate cut in comparable markets. Related article:
Read More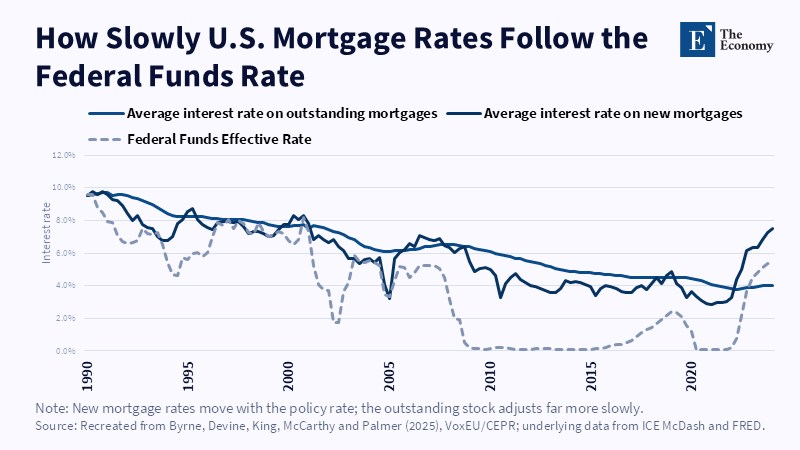
Figure 2: New mortgage rates track the federal funds rate closely; the outstanding stock adjusts far more slowly and with a lag of years. Related article:
Read More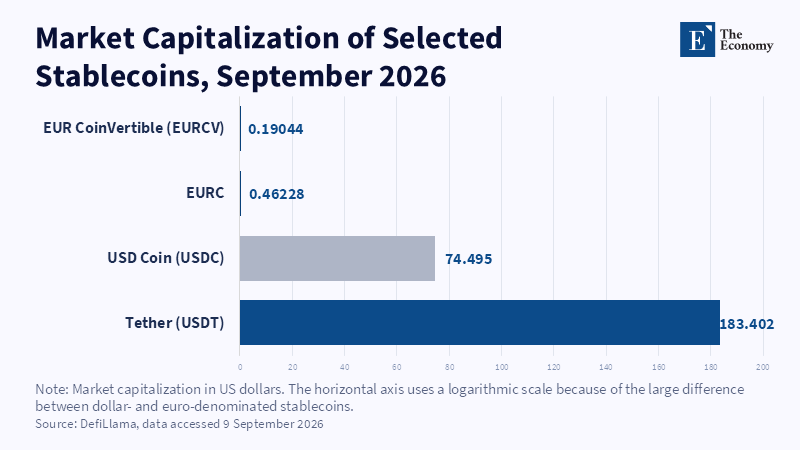
Figure 2: MiCA's redemption promise leaves the EU issuer as the only fixed point when outflows accelerate. Related article:
Read More
Figure 1: Even after MiCA's compliance boost, dollar-pegged stablecoins outweigh their euro counterparts by roughly 400 to 1. Related article:
Read More







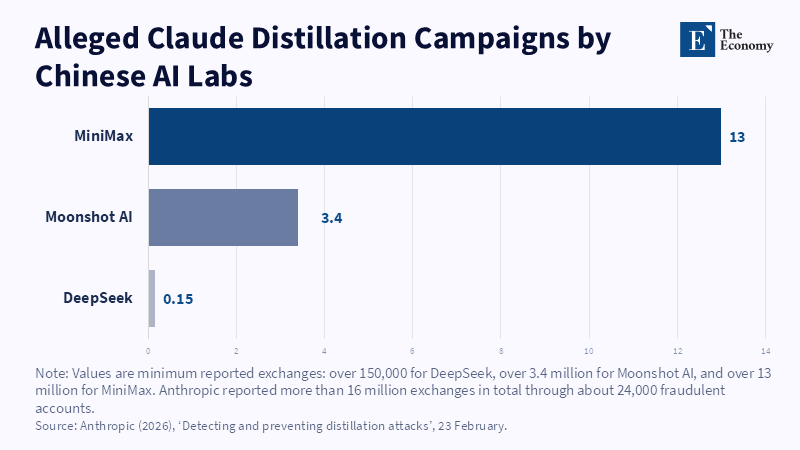
Figure 2: MiniMax accounted for nearly four-fifths of the exchanges Anthropic attributes to distillation, dwarfing Moonshot's and DeepSeek's shares. Related article:
Read More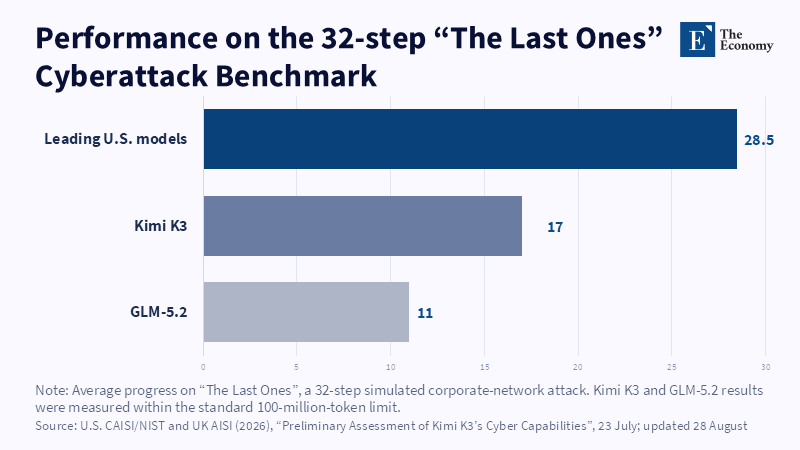
Figure 1: On a 32-step simulated attack, Kimi K3 completed barely six of every ten steps the leading US models did. Related article:
Read More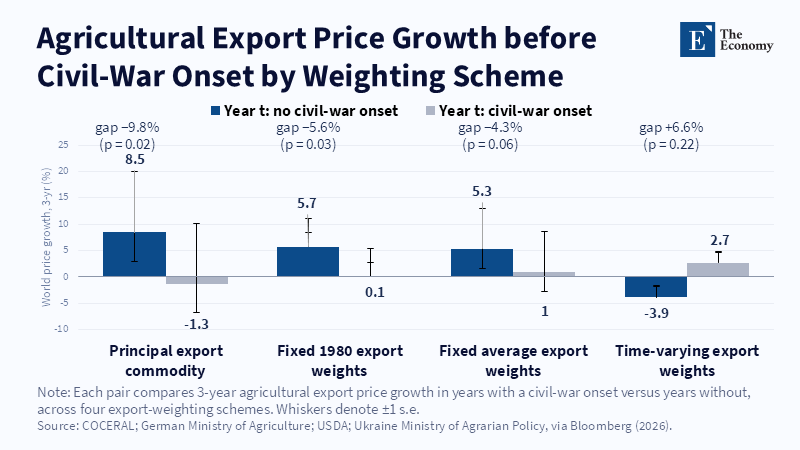
Figure 1: Prices tend to rise before peaceful years and stall or reverse before conflict. Related article: G
Read More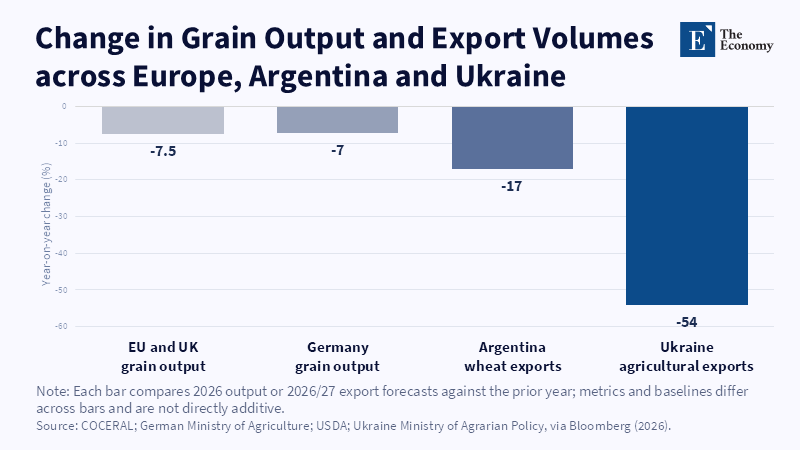
Figure 2: Three exporters' supply retreats at once, not one at a time. Related article: Grain Prices in E
Read More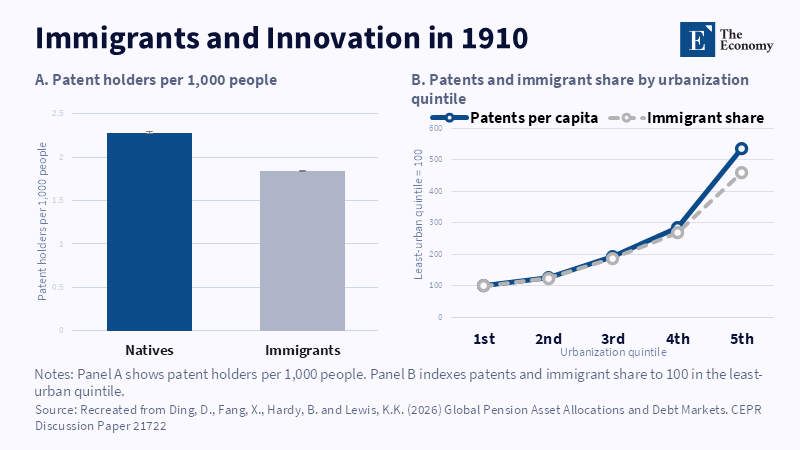
Figure 1: Patenting and immigrant concentration rose with urbanisation. Related article: Migration an
Read More
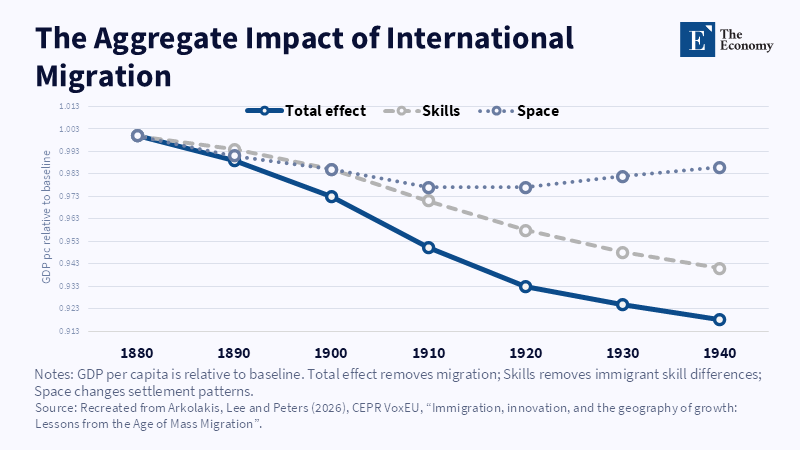
Figure 2: Skills account for most of the modeled GDP effect. Related article: Migration and Econom
Read More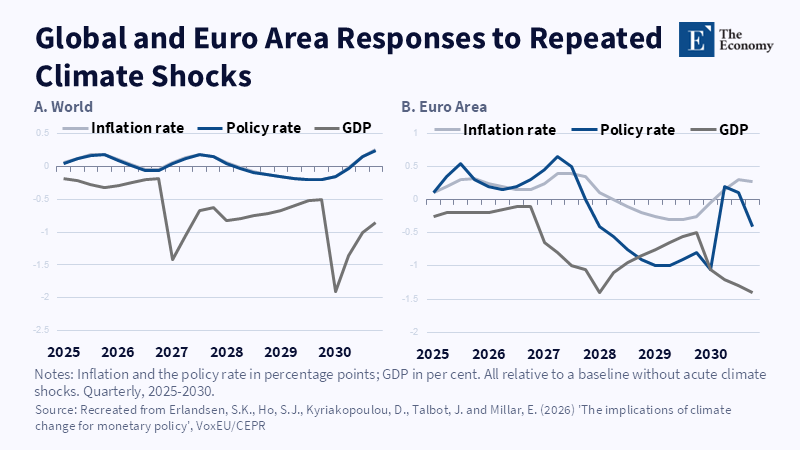
Figure 1: Euro area GDP falls sharply in the model's El Niño years, 2027 and 2030, while inflation and the policy rate move the other way; the world follows the same pattern on a smaller scale.
Read More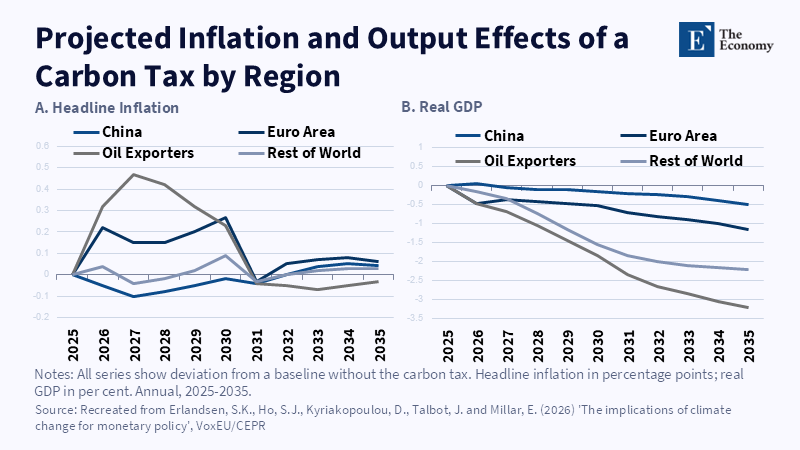
Figure 2: A carbon tax aligned with national targets lifts inflation and depresses output most in oil-exporting economies; advanced economies see smaller, shorter-lived effects. Relat
Read More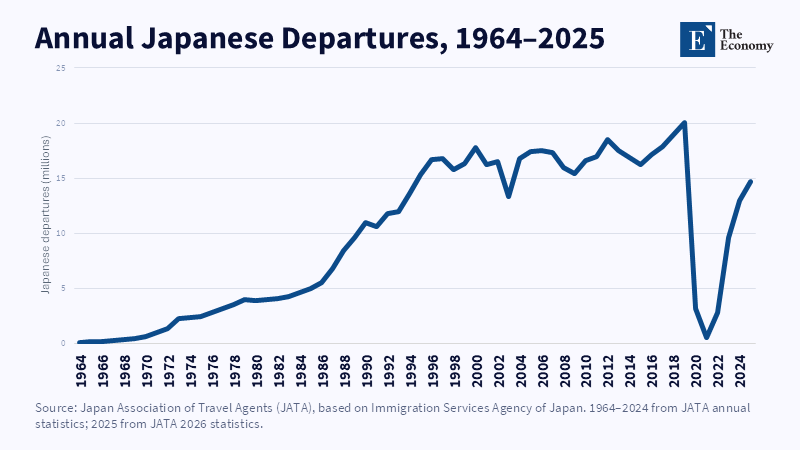
Figure 2: Japanese departures accelerated after 1985 and peaked in 2019. Related article: Weak Yen Explains
Read More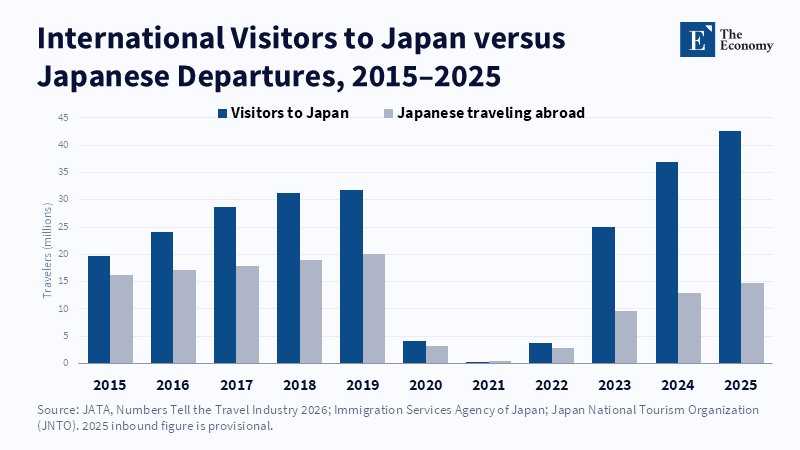
Figure 1: Inbound arrivals have surged while Japanese departures remain below 2019. Related article: Weak Ye
Read More
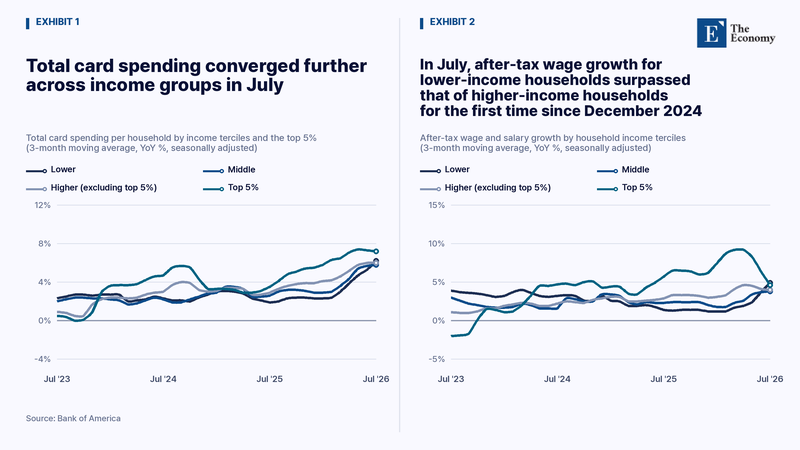
Note: In July, lower-income households’ after-tax wage growth surpassed that of higher-income households for the first time since December 2024, further narrowing the gap in card-spending growth. Related Articles:
Read More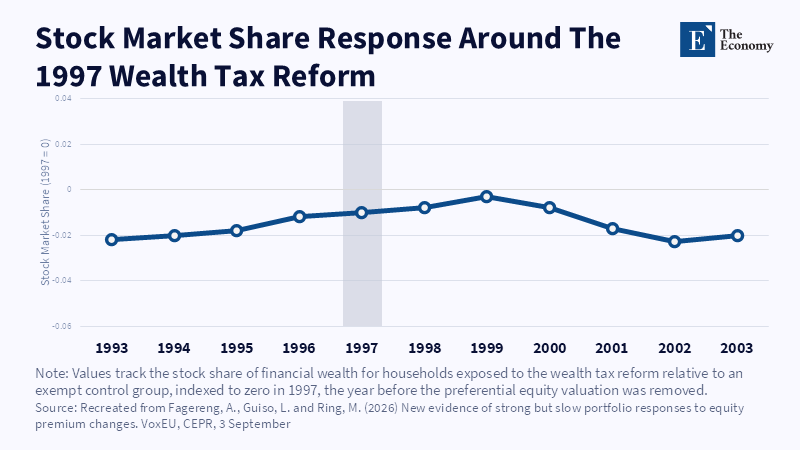
Figure 2: Affected households' stock share peaks in 1997, then drifts down over several years. Related article:
Read More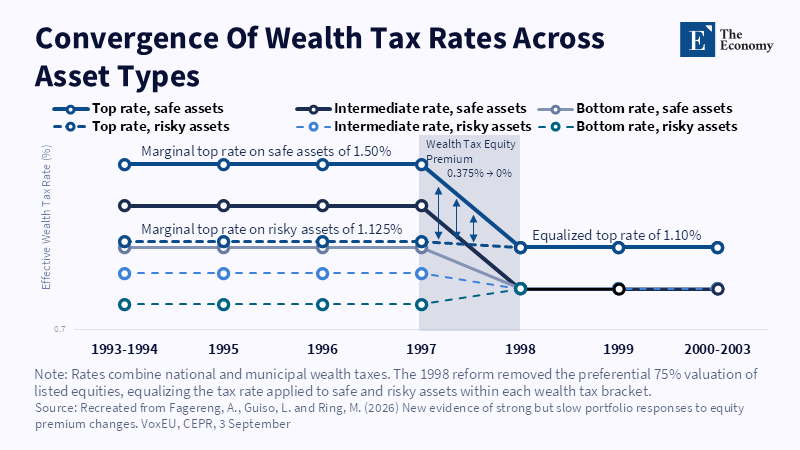
Figure 1: Wealth tax rates on safe and risky assets converge after the 1998 reform removed the valuation gap. Related article:
Read More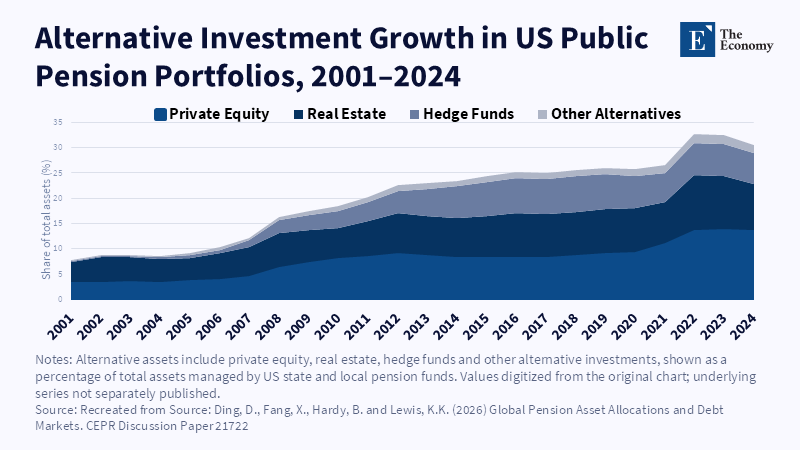
Figure 2: Alternative assets in US state and local pension portfolios have more than tripled since 2001, with the sharpest rise since 2021. Related article:
Read More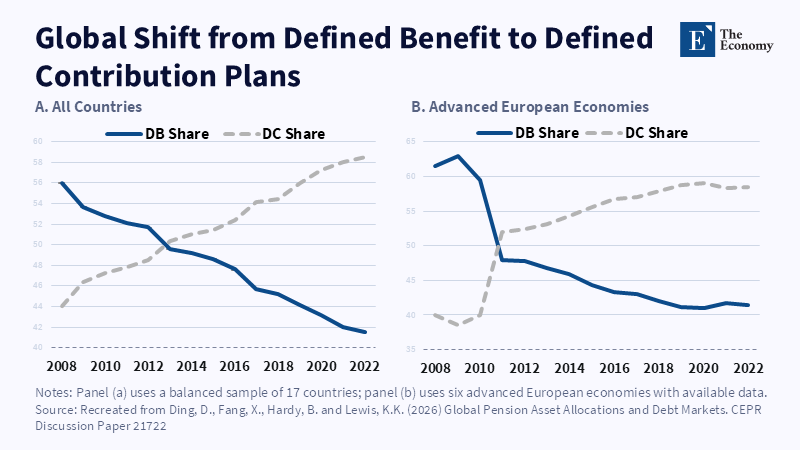
Figure 1: DB share falls below 50% globally around 2013; in advanced Europe, the same crossover happens abruptly near 2011.
Read More