Industry
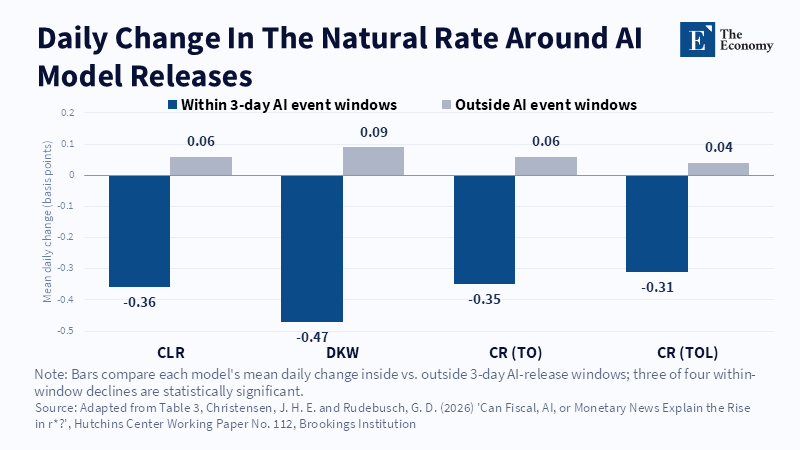
Figure 8: Fiscal news pushes r* up modestly; AI and Fed-meeting news both pull it down. Related article:
Read More
Figure 7: R* falls on AI-release days and edges up on all other days, the reverse of what a capital-demand story would predict. Related article:
Read More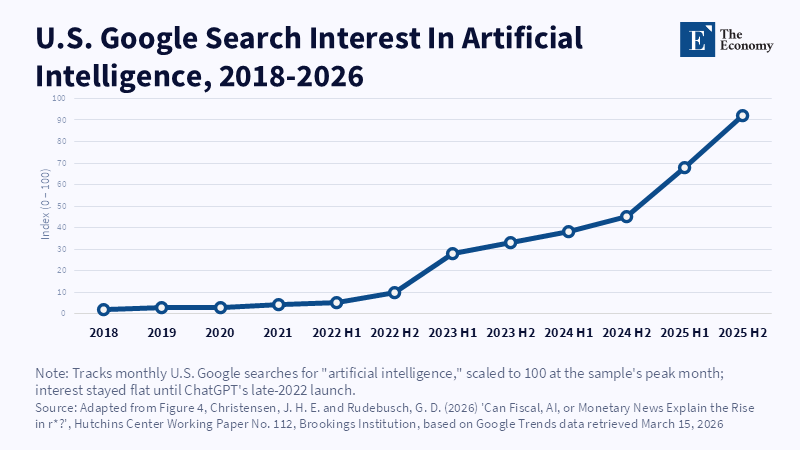
Figure 6: Public attention was flat for years, then surged after ChatGPT's late-2022 debut.
Read More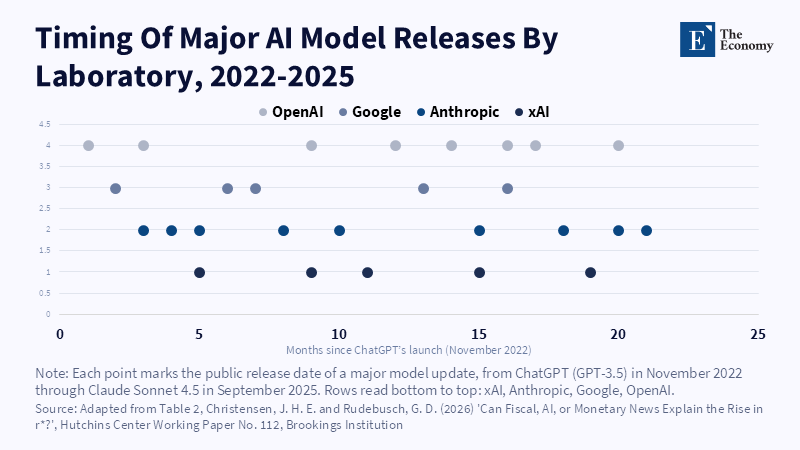
Figure 5: Four labs releasing major updates in overlapping waves, roughly every one to two months by 2024. Related article:
Read More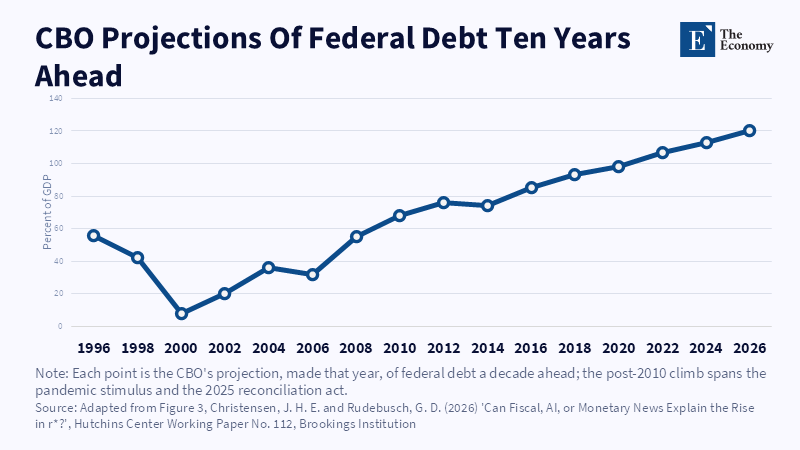
Figure 4: A decade-ahead debt forecast that has climbed almost without interruption since 2010. Related article:
Read More






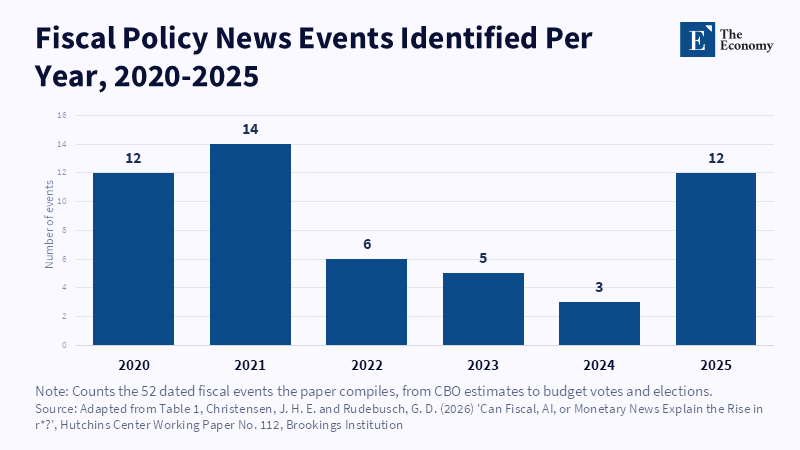
Figure 3: Fiscal news clusters around pandemic relief in 2020–21 and the reconciliation fight in 2025. Related article:
Read More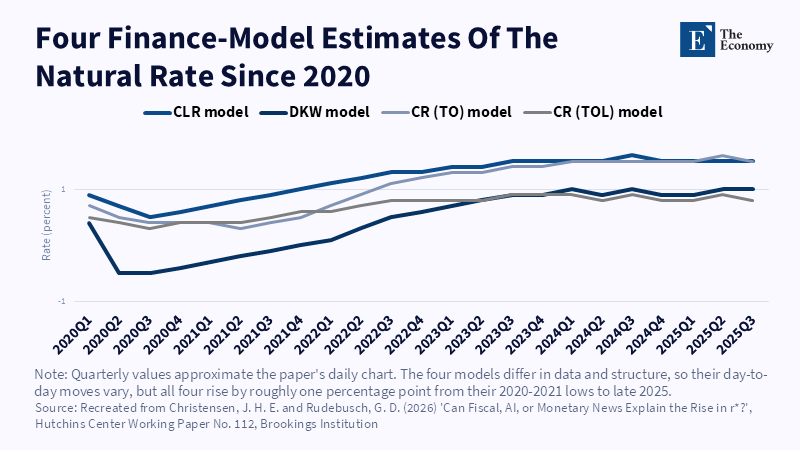
Figure 2: The four models disagree on level but move in the same direction since the 2020–21 lows. Related article:
Read More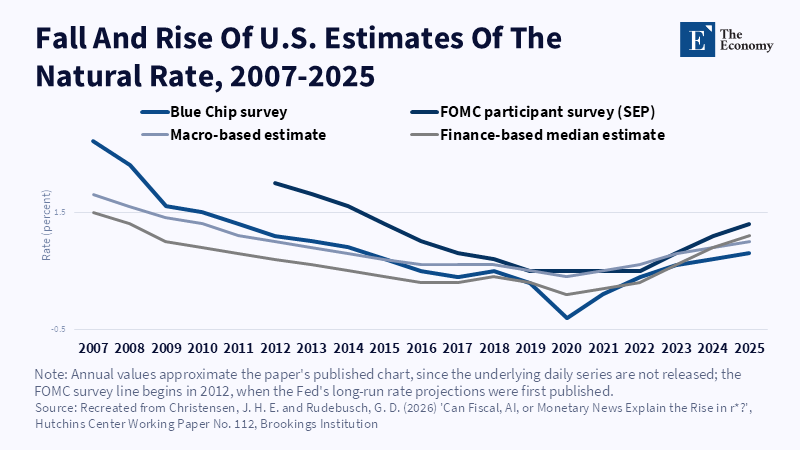
Figure 1: Four independent methods agree: r* fell for over a decade, then reversed by roughly a point after 2020. Related article:
Read More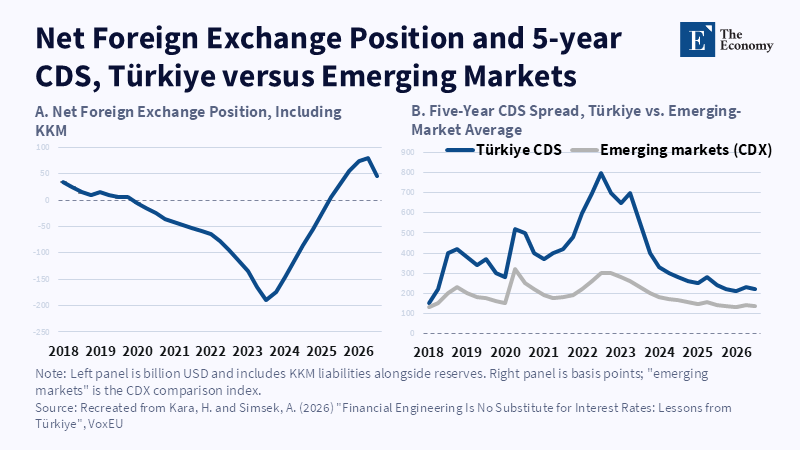
Figure 1: Fiscal exposure widened as KKM liabilities grew and investors priced the risk through 2023 Related article: Financia
Read More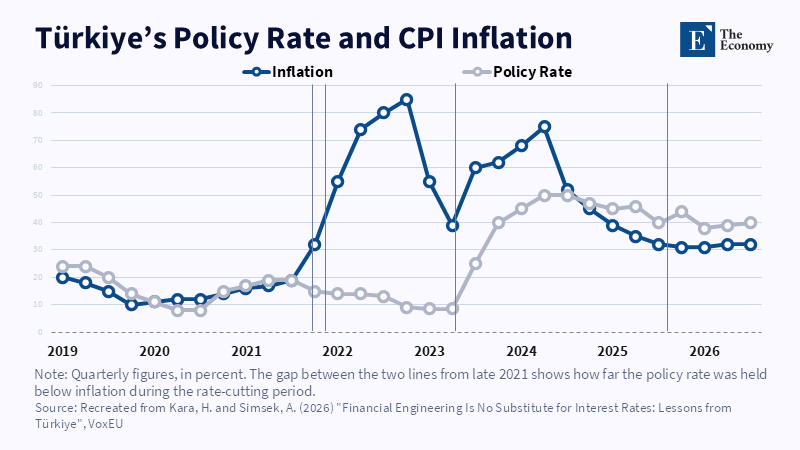
Figure 1: Rates fell as inflation climbed, then reversed once orthodoxy returned in 2023 Related article: Financial Engineering
Read More
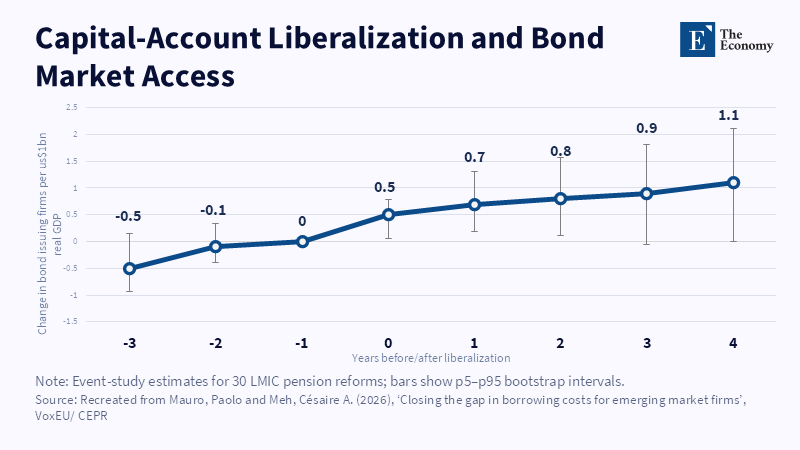
Figure 1: Bond market participation rises steadily after capital-account liberalisation. Related article: Borrowing Costs in Emerging
Read More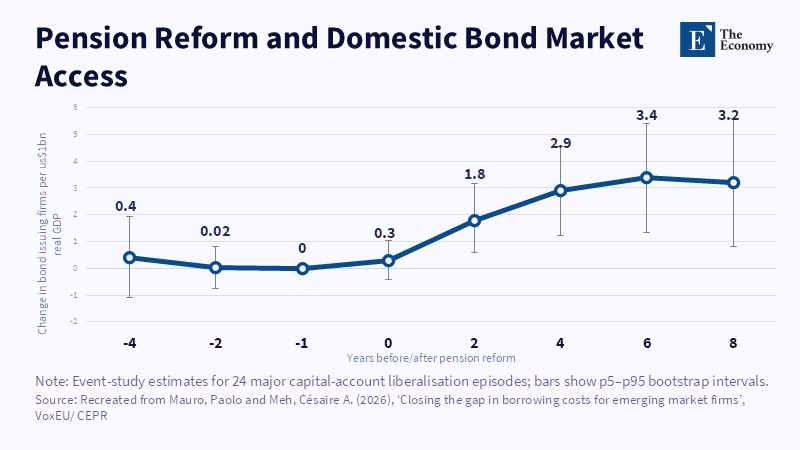
Figure 1: Pension reform broadens corporate access to domestic bond markets. Related article: Borrowing Costs in Emerging Markets: Th
Read More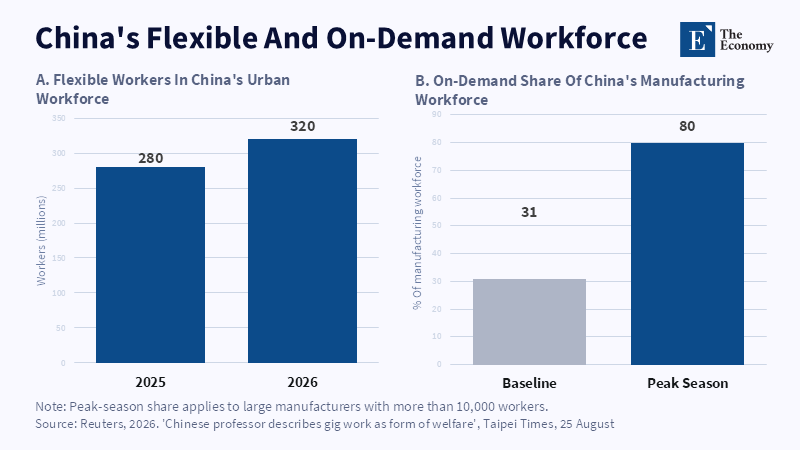
Figure 1: Nearly half of urban China now works without a permanent contract and on-demand hiring dominates factory floors at peak season. Related article: Precar
Read More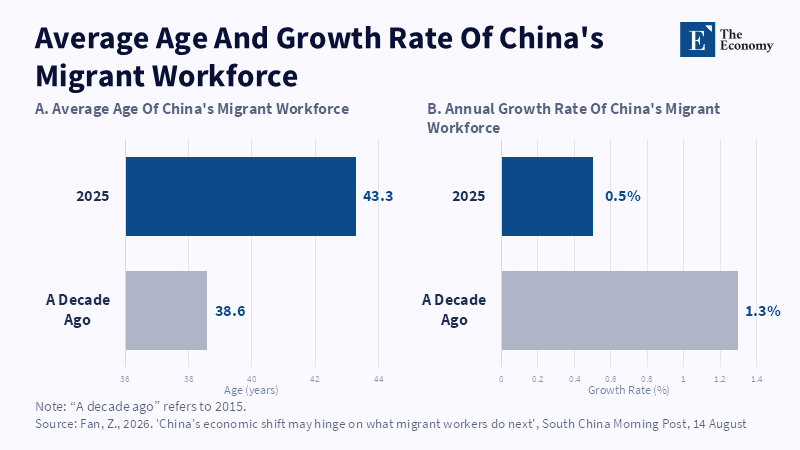
Figure 1: China's migrant workforce is aging fast and barely growing, undercutting the labor base a consumption economy needs. Related article: Precarious Work
Read More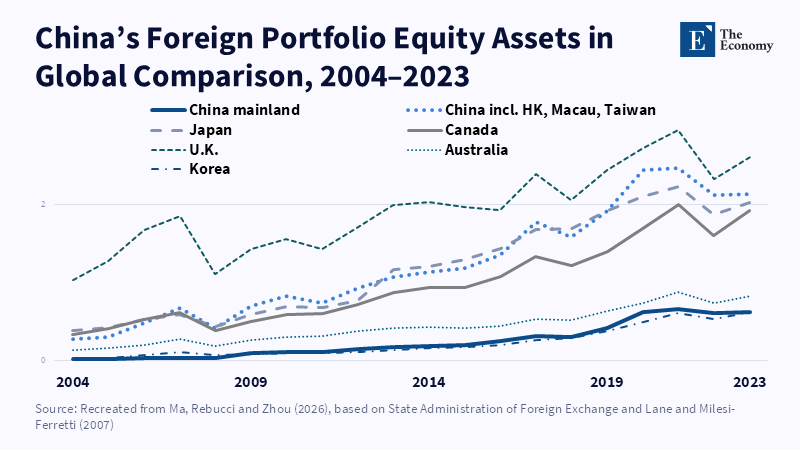
China’s overseas equity position has grown from marginal to globally relevant. Related Articles: China’s Financial Influence Is Reaching A
Read More
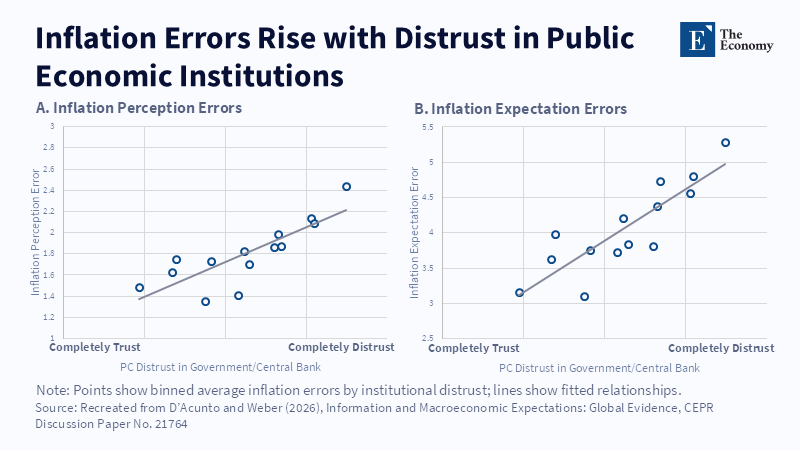
Inflation perception and expectation errors rise as distrust in public economic institutions increases. Related Articles: The Hirshleifer Effect: When
Read More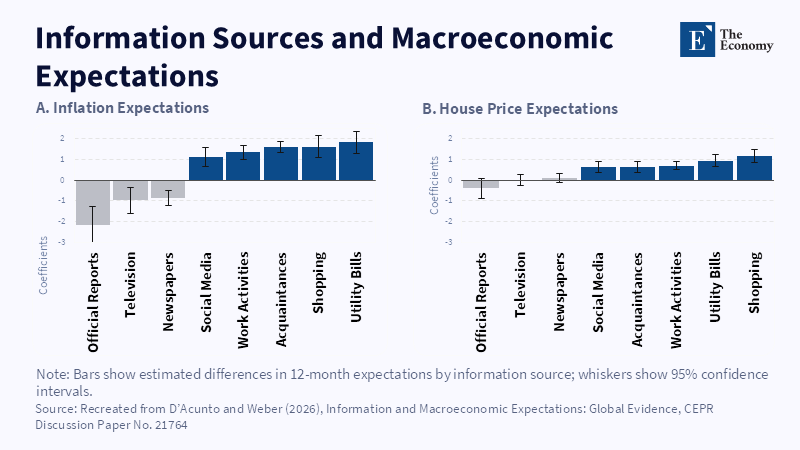
Local information sources are associated with higher expectations, while aggregate sources tend to point lower. Related Articles: The Hirshleifer Effec
Read More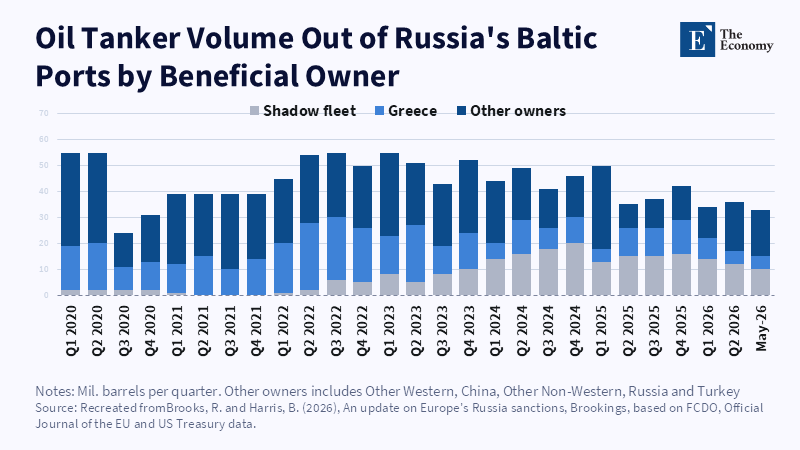
The shadow fleet's share of Baltic exports kept growing through six rounds of sanctions. Related Articles: [Russian Sanctions] A Larger Package
Read More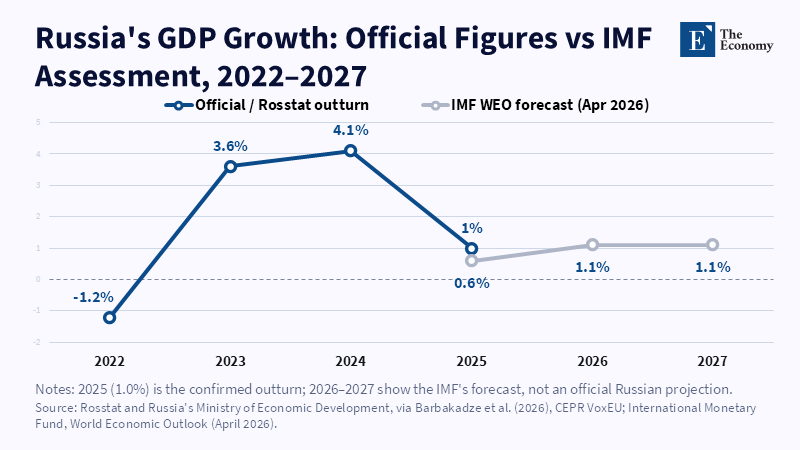
The official recovery narrative stops exactly where independent estimates begin. Related Articles: [Russian Sanctions] What Satellite Data Reveals Behin
Read More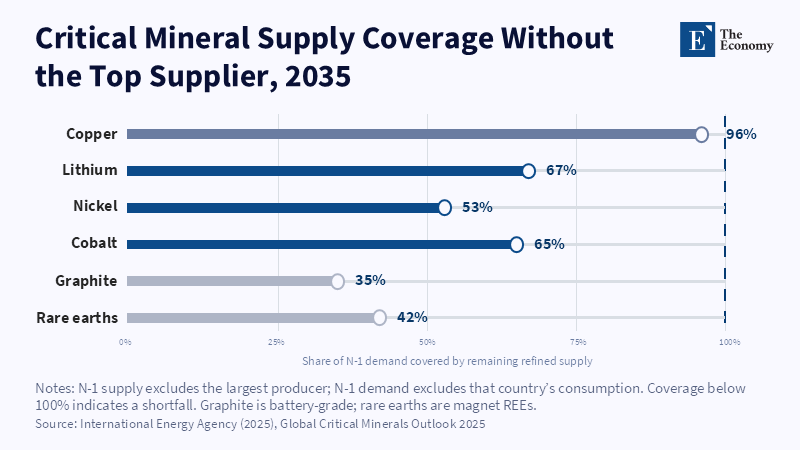
Losing one dominant supplier leaves major strategic materials exposed. Related Articles: China Decoupling and the $23.6 Trillion Cost of Economic Securi
Read More