Industry
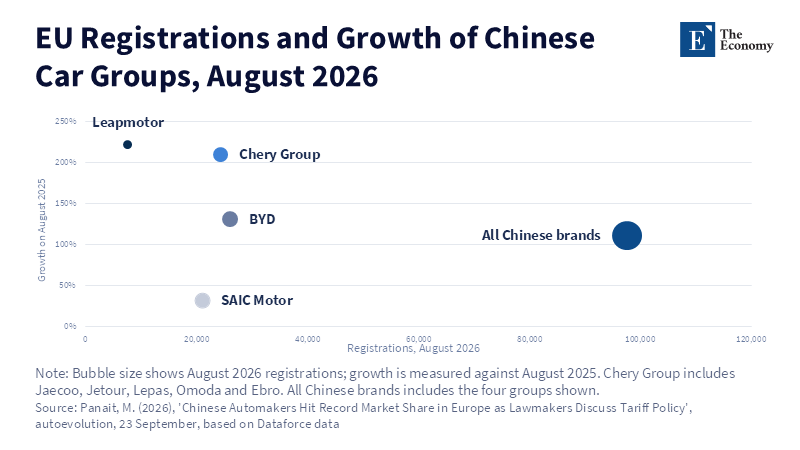
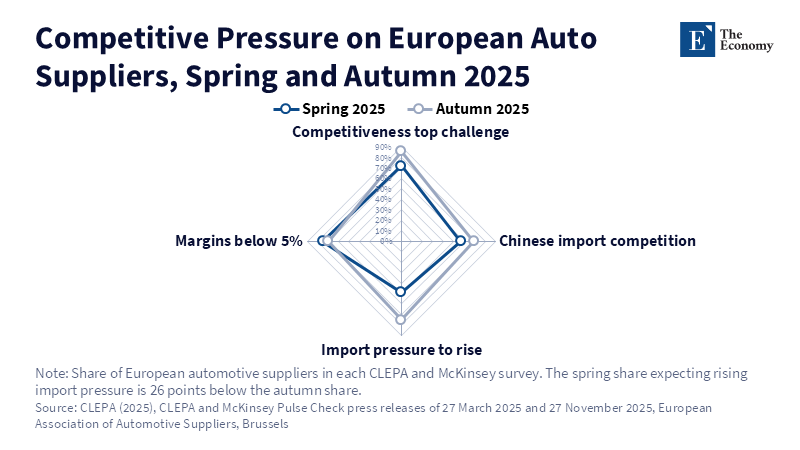
Related article: European Car Industry: The Case for Temporary Protection
Read More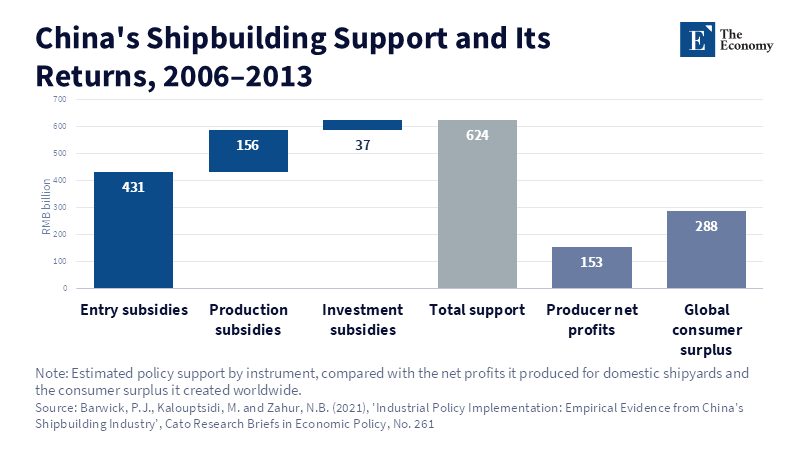
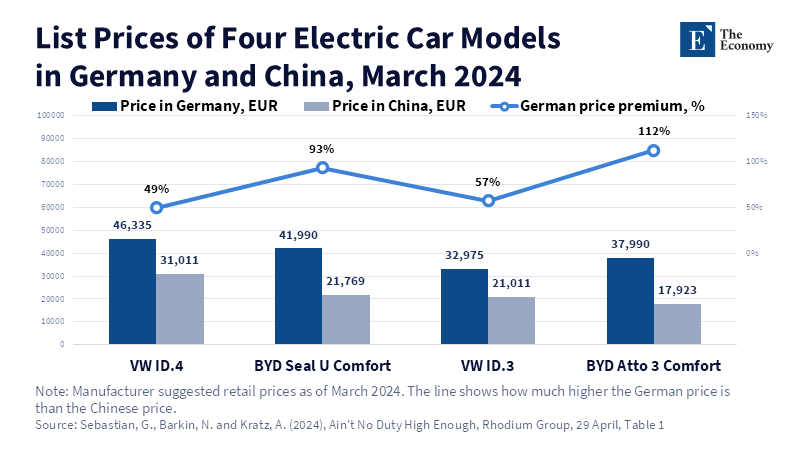
Figure 4. BYD's German prices ran 93% to 112% above its Chinese ones, nearly double Volkswagen's premium.
Read More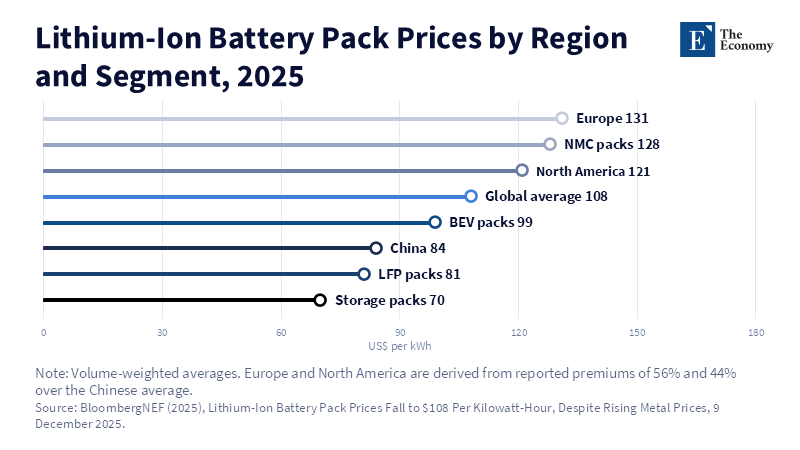








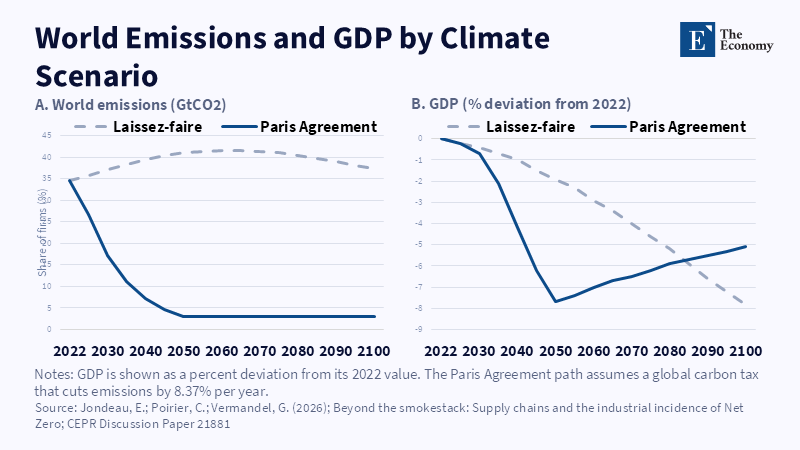
Figure 1: Emissions fall to 3 GtCO2 by 2050 under Paris, at an early GDP cost Related article: Carbon Tax
Read More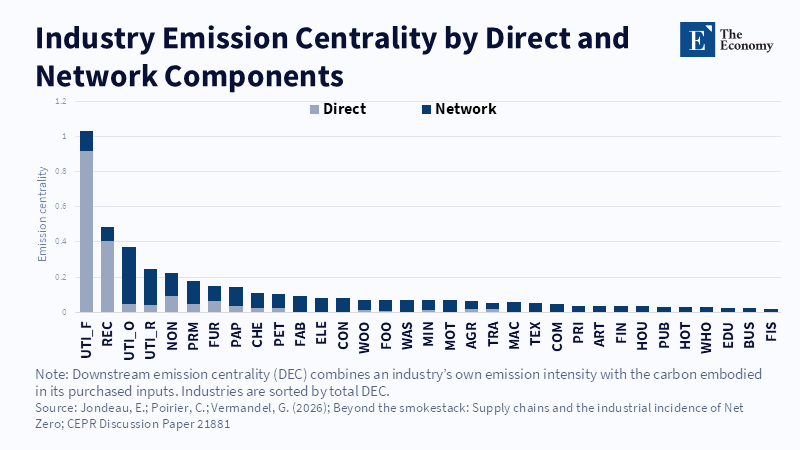
Figure 2: Network exposure outweighs direct emissions for most industries Related article: Carbon Tax an
Read More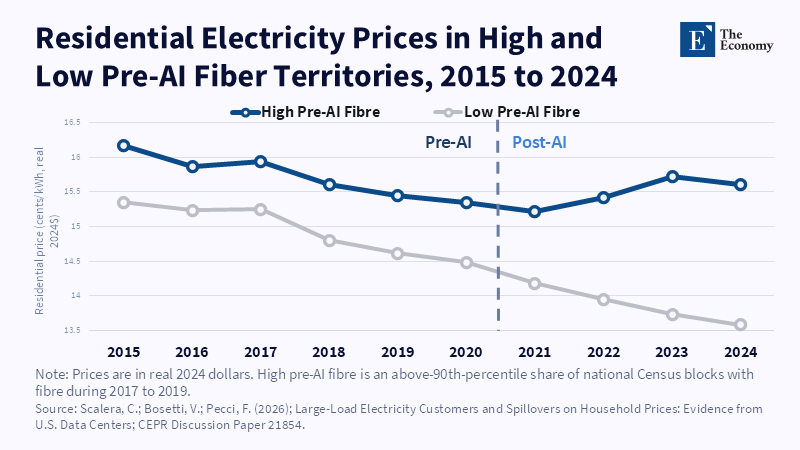
Figure 1: Openings jump from 137 to 212 in 2021, while spending accelerates only from 2023.
Read More
Figure 2: After 2021, high-fiber prices rebound to about 15.6 cents while low-fiber prices keep falling. Related article:
Read More
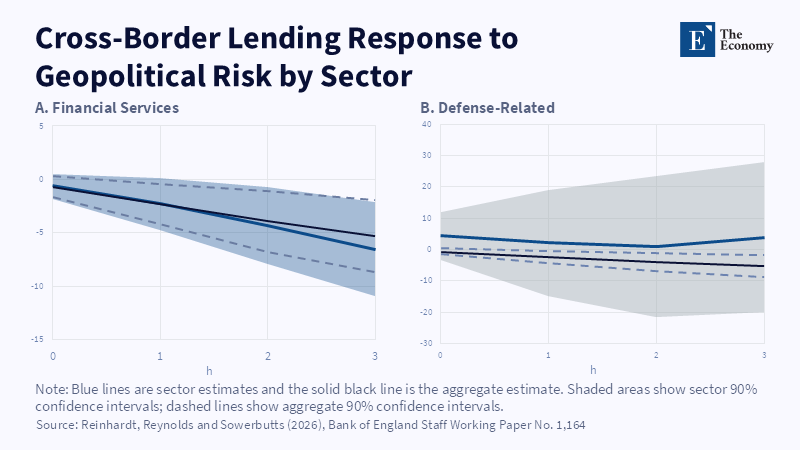
Figure 1: Lending to financial firms keeps falling across the horizon, while defence-related lending shows no clear decline. Related article:
Read More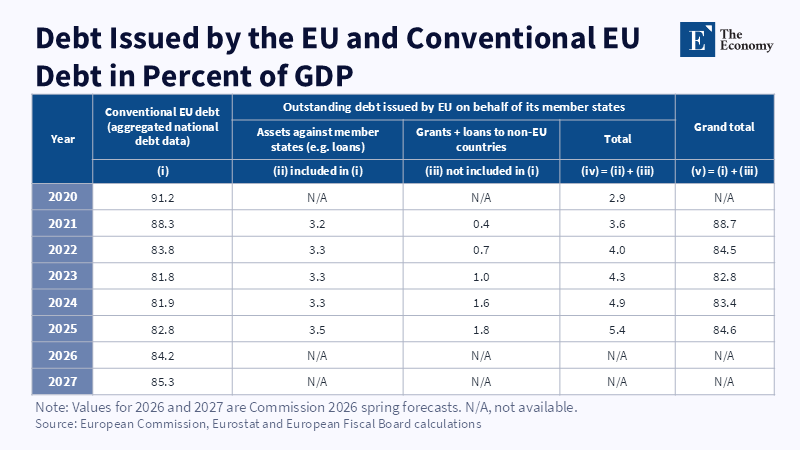
Figure 2: EU-issued debt rose from 2.9 percent to 5.4 percent of GDP between 2020 and 2025, lifting the comprehensive measure 1.8 points above the conventional one.
Read More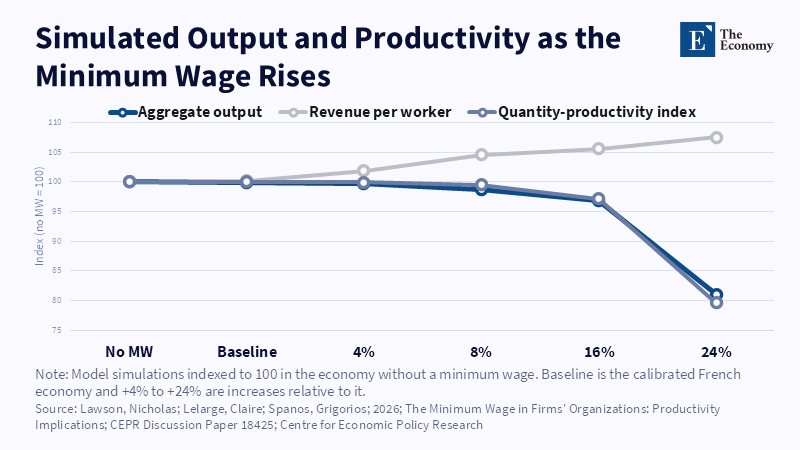
Related article: Minimum Wage Effects: The Hidden Costs Inside Firms
Read More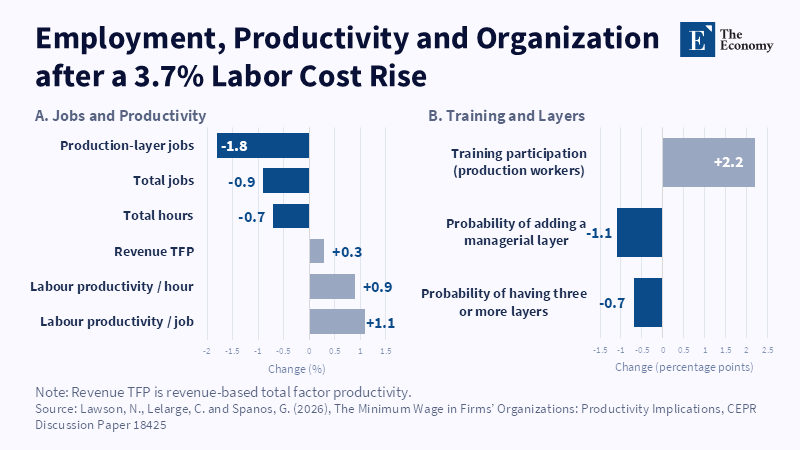
Related article: Minimum Wage Effects: The Hidden Costs Inside Firms
Read More
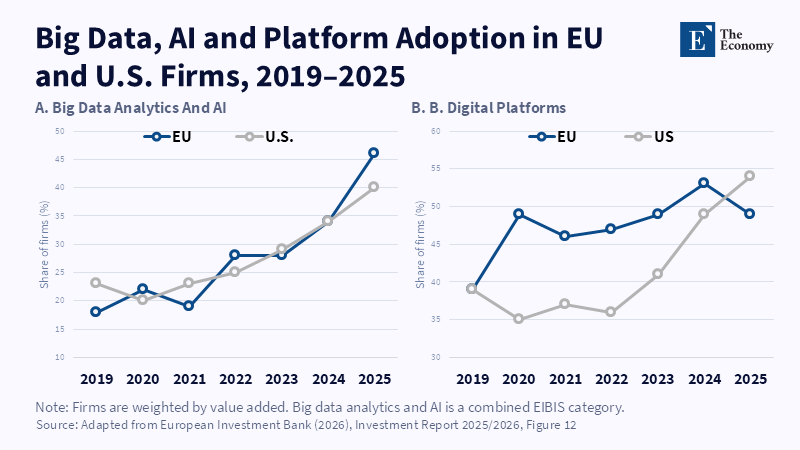
Figure 1: EU and U.S.
Read More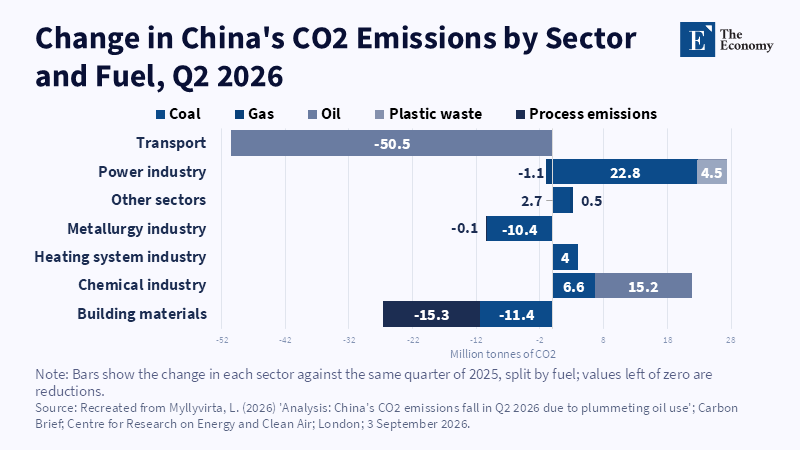
Related article: China and Fossilflation: How Renewables and Coal Kept Rates Still
Read More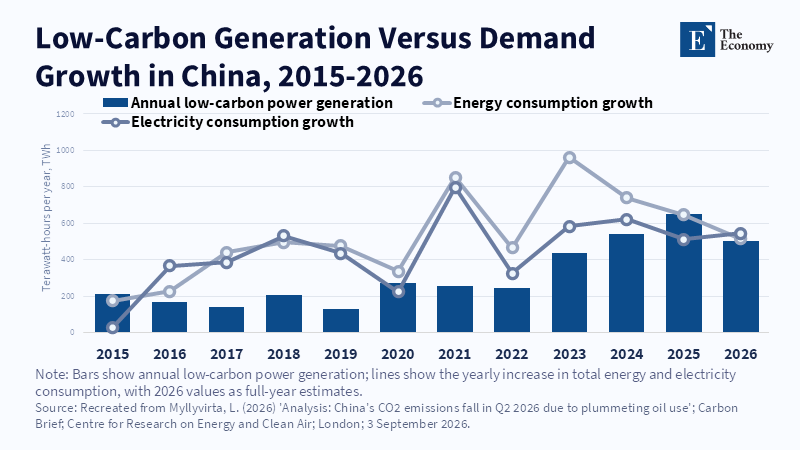
Figure 2: Low-carbon generation now nearly matches yearly growth in power demand. Related article: China and
Read More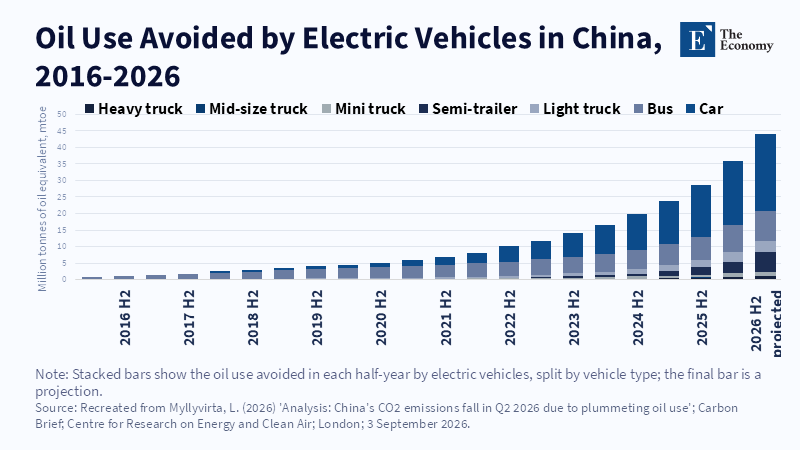
Figure 1: Electric vehicles now displace oil at a pace that doubles every two years. Related article: China a
Read More
Related Articles: “Divided by Tariffs, United in the Arctic”: China-Russia Alignment Draws North America Together as U.S. and Canada Drill to Accelerate Bering Sea Interceptions | News — The Economy
Read More