“From Stake Sales to Prime Site Acquisitions” Massive Capital Pours into Data Centers Amid AI Boom, Fueling M&A Frenzy in South Korea and the US
“From Stake Sales to Prime Site Acquisitions” Massive Capital Pours into Data Centers Amid AI Boom, Fueling M&A Frenzy in South Korea and the US

As one of the youngest members of the team, Tyler Hansbrough is a rising star in financial journalism. His fresh perspective and analytical approach bring a modern edge to business reporting. Whether he’s covering stock market trends or dissecting corporate earnings, his sharp insights resonate with the new generation of investors.
Authored On
Modified
“Exit While Asset Values Are High”: US Data Center M&A Accelerates
“Data Center-Ready Sites” with Transmission Lines and Substations Also Command Premium Prices
Bidding War Emerges for SK’s Ulsan AI Data Center in South Korea
A wave of stake sales among US data center developers is gathering momentum. As the artificial intelligence (AI) boom sends data center valuations soaring, existing investors struggling to shoulder massive construction costs and the burden of expanding power infrastructure are accelerating capital recovery and seeking to spread the risks associated with subsequent investment. The resulting merger and acquisition (M&A) frenzy is extending beyond controlling and equity stakes to prime sites already connected to the power grid, while large-scale acquisition contests are also taking shape in South Korea and other markets.
Wave of M&A Sweeps US Data Center Market
On July 13, local time, The Wall Street Journal (WSJ) reported that “data center developers and operators across the United States are seeking to sell majority stakes, including management control, and are working with investment banks to identify prospective buyers.” The assets on the market include Netrality Data Centers, DataBank, Edged and EdgeCore Digital Infrastructure, with DataBank representing the largest potential transaction. DataBank is owned by a consortium led by digital infrastructure investment firm DigitalBridge, with major investors including Swiss Life, Électricité de France affiliate EDF Invest and Australian pension fund AustralianSuper. Market estimates place DataBank’s total enterprise value at as much as $25 billion.
EdgeCore has also entered a formal sale process, inviting prospective buyers to submit acquisition proposals. Owned by Swiss private equity firm Partners Group, EdgeCore is a major data center developer that operates and develops hyperscale facilities for cloud service providers across six US markets, including Virginia and Arizona. The company has secured or is developing approximately 1.8 gigawatts (GW) of power capacity. Partners Group has committed about $5.9 billion in capital to date, with a further $16.1 billion in planned investment.
The succession of stake-sale attempts reflects the simultaneous surge in data center asset values and the growing capital burden required for further expansion. Data center construction costs continue to rise sharply. The increase stems from mounting supply constraints affecting skilled labor, including electricians and plumbers, as well as gas turbines, memory chips and electrical equipment. Nvidia Chief Executive Officer (CEO) Jensen Huang has estimated that building 1GW of new AI computing capacity based on the company’s semiconductor architecture could cost between $80 billion and $100 billion in the years ahead. For data center operators, it may therefore be rational to cash out existing investors while asset values remain elevated and bring in large private equity funds capable of assuming subsequent investment requirements and permitting risks. Buyers, meanwhile, can secure stable cash flows through long-term lease agreements with Big Tech companies.
Value of Grid-Connected Sites Comes into Focus
Sites suitable for data center development are also beginning to change hands at exceptionally high prices. According to the WSJ, 96 landowning households in Salem Township in northeastern Pennsylvania recently sold approximately 1,700 acres, or 6.88 million square meters, to QTS, a data center developer owned by US private equity firm Blackstone, for a combined $586 million. The average sale price was $330,000 per acre. That matched or exceeded the land-use compensation paid to local residents during Pennsylvania’s natural gas development boom more than two decades ago.
Developers were drawn to the site because it could provide a stable supply of the electricity needed to operate data centers. Salem Township already had transmission lines and substations connecting nearby natural gas and nuclear power plants. Electricity generated at power plants travels to areas of demand through high-voltage transmission networks. Substations convert voltage, distribute power flows and isolate faulted sections to prevent failures from spreading to other equipment. Reliable substation connections equipped with multiple transmission routes, transformers and switchgear are particularly essential for facilities such as data centers, which consume enormous amounts of electricity around the clock without interruption.
The problem is that the expansion of US power infrastructure has failed to keep pace with data center construction. Transmission-line projects take years to complete because of complex procedures involving local government approvals, compensation negotiations with landowners and environmental impact assessments. Nor can the supply of critical substation equipment be expanded immediately. Large power transformers, in particular, must be custom-built to meet each customer’s voltage, capacity and grid specifications, while supplies of essential inputs such as grain-oriented electrical steel and copper, as well as testing capacity, remain constrained. For data center operators, sites already equipped with high-voltage transmission lines and large substations are therefore more than mere parcels of land: They are scarce assets that effectively include grid-interconnection rights.
SK Data Center Seeks Outside Investors
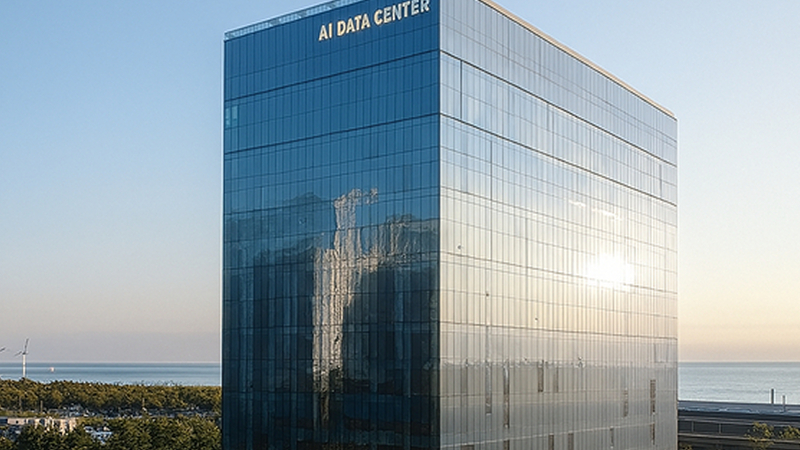
This aggressive investment trend is also evident in markets outside the United States. A prominent example is SK Group’s proposed stake sale in its Ulsan data center. SK Telecom announced in June last year that it would build a dedicated AI data center with Amazon Web Services (AWS) at the Mipo National Industrial Complex in Ulsan. Designed to accommodate approximately 60,000 graphics processing units (GPUs) for AI training and inference, the project is being led by SK Telecom and SK Broadband, with SK ecoplant responsible for construction. SK plans to begin operating the first-phase facility, with a capacity of around 40 megawatts (MW), by the end of 2027 and expand total capacity to approximately 100MW by 2029.
The industrial complex surrounding the data center is home to SK Multi Utility’s 300MW cogeneration plant and the 1.2GW Ulsan GPS power plant backed by SK Gas. With delays in grid connections emerging as a major obstacle to global data center development, the project is designed to ensure a stable electricity supply by locating the data center near existing power-generation facilities. Just months after construction began, SK launched a stake-sale process in December last year. Under the proposed structure, SK would retain management control with a 51% stake, while outside investors would acquire the remaining shares. At the time, SK was seeking approximately $1.34 billion in sale proceeds, with the data center’s total equity value estimated at between $2.01 billion and $2.68 billion.
The sale process gathered momentum following bidding in January. Global private equity firm KKR, Brookfield Asset Management and South Korean private equity firm IMM Investment participated in the acquisition contest. Brookfield subsequently withdrew, leaving KKR and IMM Investment in a two-way race. IMM Investment later formed a consortium with Stonebridge Capital to strengthen its financial capacity. After both sides demonstrated strong acquisition interest, SK proposed in March that the stake be divided between KKR and the IMM Investment-Stonebridge consortium. Under the proposed structure, KKR would acquire a 29% stake, while the IMM Investment-Stonebridge consortium would purchase 20%. KKR’s investment was estimated at approximately $1.07 billion, while the IMM Investment-Stonebridge consortium was expected to invest about $872 million. The total transaction was valued at between $1.68 billion and $2.01 billion, exceeding initial estimates. A simple calculation based on the proposed ownership stakes would place the Ulsan data center’s total value above $3.35 billion.
SK formally selected KKR and the IMM Investment-Stonebridge consortium as preferred bidders in May and continued detailed negotiations with the aim of signing a share purchase agreement (SPA) by the end of June. However, a definitive agreement has yet to be signed. The biggest variable is financing by the IMM Investment-Stonebridge consortium. While KKR can draw on an existing large-scale infrastructure fund, IMM Investment must establish a new project fund and secure approximately $671 million in commitments from pension funds, mutual aid associations and other institutional investors. The consortium is also reportedly considering potential participation by the National Growth Fund. KKR, meanwhile, is discussing the possibility of raising around $671 million in acquisition financing from Samsung Securities and other institutions instead of funding the entire purchase through its own fund.
As one of the youngest members of the team, Tyler Hansbrough is a rising star in financial journalism. His fresh perspective and analytical approach bring a modern edge to business reporting. Whether he’s covering stock market trends or dissecting corporate earnings, his sharp insights resonate with the new generation of investors.
Similar Post