The Sticky Triangle: Why Inflation Persists Above Target Despite Falling Energy Prices

Input
Modified
This article is based on ideas originally published by VoxEU – Centre for Economic Policy Research (CEPR) and has been independently rewritten and extended by The Economy editorial team. While inspired by the original analysis, the content presented here reflects a broader interpretation and additional commentary. The views expressed do not necessarily represent those of VoxEU or CEPR.
America’s price pressure now behaves like a kaleidoscope rather than a single‐colored lens: turn it slightly, and the pattern of forces reshapes itself, yet the overall picture still points to an inflation rate that refuses to nestle back at 2%. Long-term expectations have become sticky above 3%, wage growth still outpaces productivity, and the whipsaw in energy and vehicle prices alternately masks and magnifies the underlying trend. Until policymakers and the public recognize how these three moving pieces reinforce one another, the United States risks sliding into a new equilibrium in which three-percent inflation is not an “overshoot” but the new normal.
Re-drawing the Teaching Triangle
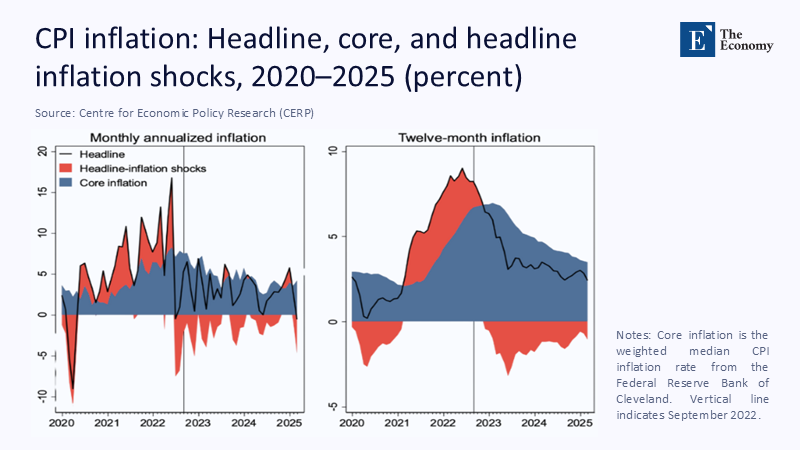
The CEPR “triangular” framework—expectations, labor-market tightness, and relative-price shocks in energy and autos—remains the best classroom sketch of post-pandemic inflation dynamics. Yet, the relative lengths of its sides have shifted markedly since headline CPI peaked at 9% in June 2022. Today, headline inflation sits at 2.4% year-on-year, while the core gauge persists at 2.8%. That stubborn core is telling us something crucial: the index’s current level is a composite of a −0.3-point drag from cheaper energy, a +0.2-point push from surging used-car prices, and roughly +0.4 points from services tied to unit-labor costs. Strip away that arithmetic, and the triangle’s center of gravity is straightforward—the wedge between core and headline is largely about wages and expectations, not oil or gasoline alone.
Expectations: From Anchor to Live Voltage
For decades, central bankers treated five-to-ten-year inflation expectations as a 5-tonne anchor: heavy enough to steady the ship in choppy seas. That anchor is now lifting off the seabed. The February iteration of the University of Michigan survey put median five-year expectations at 3.3 %, the highest since 2008; after tariff headlines rattled households again in early spring, the distribution’s upper tail thickened so visibly that the mean expectation topped 4% even as the median eased back to 4.1% in June. This shift in the distribution of expectations can be likened to a live voltage, indicating a significant increase in the perceived future inflation rate. Markets echo the survey angst: the five-year forward TIPS breakeven has traded in a volatile 2.2-to-2.6% corridor all year, roughly 40 basis points above its 2010-2019 average. Suppose one inserts those numbers into a textbook New-Keynesian Phillips curve with an expectation elasticity of 0.4. In that case, the step-up from a 2.2 to a 3.3% expectation adds about 0.4 percentage points to next year’s core inflation projection, offsetting every bit of disinflation currently coming from cheaper petrol.
Why the Expectation Channel Matters More Now
In a low-volatility world, an extra three-tenths of long-run expectations might be background noise. Not so in a macro regime that is simultaneously digesting supply-chain re-engineering, big-ticket industrial policy, and a presidential tariff program that has become almost a quarterly ritual. Private sector forecasters surveyed by the Federal Reserve in June revised their own five-year CPI outlook to 2.9% from 2.6% just six months earlier; the Fed’s own Summary of Economic Projections now pegs headline PCE inflation at exactly 3% for 2025, essentially conceding that the glide path back to target will be flatter than first hoped. History suggests that once a central bank signals tacit tolerance of a “low-three” plateau, households recalibrate wage demands within two quarters, hardening the expectation layer that policymakers are trying to erode.
Labour-Market Tightness: Linear, Predictable—but Still Too High
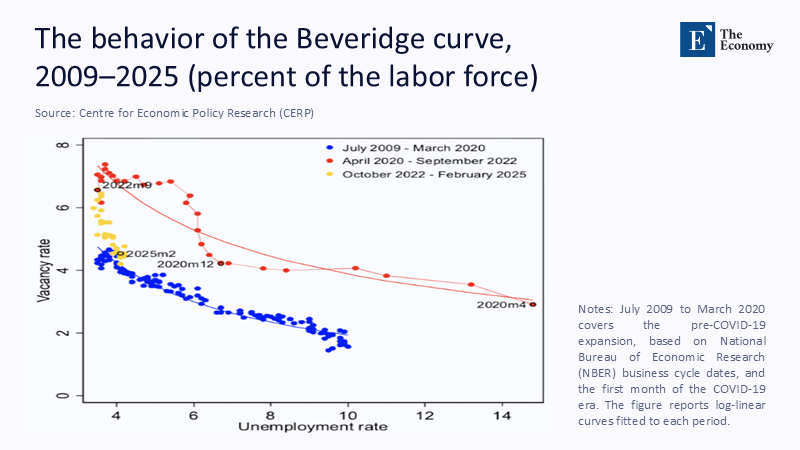
The CEPR column argues that the vacancy-to-unemployment ratio is the linchpin keeping core inflation sticky. Detractors respond that vacancies have fallen from 12.2 million to 7.4 million since the peak and that the V/U ratio now stands at a modest 1.03. Both statements are factual and miss the point illuminated by the New York Fed’s Heise-Pearce-Weber (HPW) tightness index. Because the HPW index folds in quits, transitions, and Beveridge-curve shifts, it captures latent pressure long after headline vacancies retreats. Critically, the HPW-to-wage link is linear, not exponential: every one-point dip in tightness trims nominal wage growth by about one percentage point—no more, no less.
With the index down only 1.5 points from its pandemic high and average hourly earnings still running 3.9% year-on-year, the linear model predicts wage growth will hover near 3.1% by mid-2026 even if vacancies keep closing at today’s pace. That trajectory is still incompatible with a 2-percent inflation target so long as productivity growth lingers near 1.2%.
Crunching the Wage-Productivity Arithmetic
The arithmetic is brutal but enlightening. Unit-labour costs, the ratio of compensation per hour to output per hour, are rising by close to 2.7%. Add a trend productivity growth rate of 1.2%, and one can back-solve the steady-state inflation that firms must pass through to preserve margins: roughly 1.5% from productivity plus 2.7% from labor costs equals 4.2%. Even if competitive pressures, substitution, and margin compression absorb a third of that impulse, the residual easily keeps core PCE above 3%. The current labor market does not generate an explosive wage-price spiral but sets a floor beneath which inflation has great difficulty falling.
Energy: A Helpful Mirage
Energy prices have been the hero of headline disinflation during the past twelve months. The CPI energy sub-index fell 3.5% over the year to May, slicing roughly 0.3 percentage points off headline inflation and creating the illusion that price pressures are ebbing across the board. Yet the Energy Information Administration’s June Short-Term Outlook forecasts an average national gasoline price of $3.14 per gallon for the key summer driving season—hardly cheap by historical standards and only one adverse geopolitical headline away from another surge. Because energy carries an 8-percent weight in the CPI basket but only a 5-percent weight in the PCE gauge that the Fed watches, even a moderate rebound to $3.40 would feed headline prints before policymakers saw it in their preferred metric, sowing confusion about whether the inflation battle is being won or merely postponed.
Autos: The Shock That Echoes
If energy is the “helpful mirage,” autos are the mirror image: a sector whose price shocks echo through core goods for months. The Manheim Used Vehicle Value Index climbed to 205.9 in mid-May, 4.4% higher than a year earlier, even after an intra-month retreat. The new-vehicle market is more alarming. Cox Automotive and Reuters report that average transaction prices jumped 2.5% in April—the steepest monthly rise since the early pandemic frenzy—after the administration’s 25% tariff on imported cars pulled demand and scrambled supply chains forward. Because new and used vehicles occupy 7.2% of the CPI basket and their price changes filter into the PCE deflator with a two-quarter lag, the spring spike is scheduled to show up in official core metrics precisely when energy disinflation is fading. A straightforward elasticity exercise suggests the auto component could add 0.3 percentage points to core CPI by October, even if dealer markups stabilize tomorrow.
Interlocking Gears: How the Three Forces Reinforce One Another
Viewed together, expectations, wages, and relative-price shocks form a self-reinforcing triangle rather than three isolated levers. Higher vehicle prices feed consumer pessimism about future affordability, nudging long-term inflation expectations upward; elevated expectations embolden workers to seek cost-of-living pay rises, amplifying the HPW-wage channel; that wage growth, in turn, limits the degree to which falling energy prices can pull inflation back to target. The triangle’s angles may expand or contract, but its area—the amount of inflation it generates—remains stubbornly large. That structural interaction explains why core PCE has hovered between 2.8 and 3.2% for nine consecutive months, even as individual components gyrate wildly.
Policy at the Crossroads: Credibility Versus Comfort
The Federal Open Market Committee now projects only two quarter-point cuts through year-end 2025—down from four in the March “dot-plot”—explicitly tying the timing of any easing to a convincing downshift in wage growth. Behind the technocratic phrasing lies a frank institutional dilemma. Hitting the brakes too hard could push unemployment above 4.5% just as an election year looms; tapping them too lightly risks codifying a three-percent norm. Recent Fed communication has therefore swung from plain-English reassurance to quasi-Delphic ambiguity: Chair Powell promises “data dependence,” while Vice-Chair Jefferson stresses the need to “re-moor expectations.” Both messages amount to the same prescription—keep the policy rate in restrictive territory until average hourly earnings cool by at least one percentage point. Because the HPW link is linear, not explosive, the Fed can nudge rather than slam the brake pedal, confident that each tenth on the vacancy ratio buys a commensurate decline in wage growth. But that policy patience only works if tariff policy stops lighting fresh fires under auto prices and if geopolitical risk does not yank energy back into the spotlight.
A Forecast in Three Scenarios
A baseline path that assumes gasoline stays near $3.15, used-car prices flatten, and HPW tightness edges lower would see headline CPI hovering around 2.6% by December and core PCE stuck at 2.9%. An upside-risk scenario in which Brent crude returns to $85 and auto tariffs spread to parts and components adds a percentage point to both metrics, reigniting talk of a wage-price spiral even under the linear model. A downside-risk scenario—surprisingly swift immigration reform plus a global oil glut—could drag core to 2.4% by mid-2026, but only if expectations fall in tandem; absent that psychological shift, wage setters will pocket cheaper energy as a real-income gain and keep aiming for four-percent nominal increases. The common thread is that none of these plausible paths delivers 2% core inflation without a sustained dent in either expectations or wages.
Lessons for the Classroom and the Boardroom
The inflation debate is often framed as a hunt for a single culprit—too much fiscal stimulus, oil shocks, greedy corporations, or an overheating labor market. The evidence reviewed here says the diagnosis is more nuanced yet urgent: today’s price dynamics arise from a moving triangle in which each side amplifies the next. Expectations are no longer a dormant anchor but a live voltage; labor tightness is no longer an accelerator pedal that risks sticking to the floor but a metronome that ticks predictably faster than desired; energy and autos are no longer random shocks but recurring tremors that rattle public confidence. Teaching tomorrow’s economists to model these interactions holistically is now as important as teaching them the algebra of the Phillips curve. Only when policymakers treat expectations as policy-relevant, labor tightness as a precise amplifier, and relative-price shocks as catalysts rather than curiosities will the US escape the gravitational pull of three-percent inflation. Until then, the triangle may shrink at the margins, but it will not disappear—and the price we pay for ignoring its geometry will accumulate quietly, month after month, in every wage contract and every sticker on a dealership lot.
The original article was authored by Laurence Ball, a Professor at Johns Hopkins University, along with two co-authors. The English version of the article, titled "The rise and retreat of US inflation: An update," was published by CEPR on VoxEU.
References
Ball, L., Leigh, D., & Mishra, P. “The Rise and Retreat of US Inflation: An Update.” VoxEU, Centre for Economic Policy Research, 19 June 2025.
Bureau of Labor Statistics. “Consumer Price Index – May 2025.” 11 June 2025.
Bureau of Labor Statistics. “Employment Situation – May 2025.” 6 June 2025.
Bureau of Labor Statistics. “Job Openings and Labor Turnover – April 2025.” 5 June 2025.
Cox Automotive. “Wholesale Used-Vehicle Prices Decrease in First Half of May.” 19 May 2025.
Energy Information Administration. “Short-Term Energy Outlook.” June 2025.
Federal Reserve Board. “Summary of Economic Projections.” 18 June 2025.
Heise, S., Pearce, J., & Weber, J. “A New Indicator of Labor Market Tightness for Predicting Wage Inflation.” Liberty Street Economics, Federal Reserve Bank of New York, 9 October 2024.
Reuters. “Powell Signals Hawkish Fed Is Flying Blind.” 19 June 2025.
Reuters. “US Car Prices Higher in April after Tariffs Hit.” 12 May 2025.
Reuters. “US Consumer Sentiment Drops as Inflation Expectations Surge.” 7 February 2025.
University of Michigan. “Surveys of Consumers – Preliminary June 2025 Results.” 14 June 2025