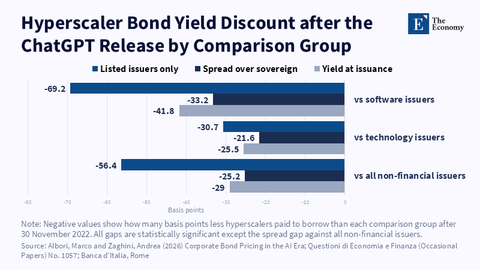
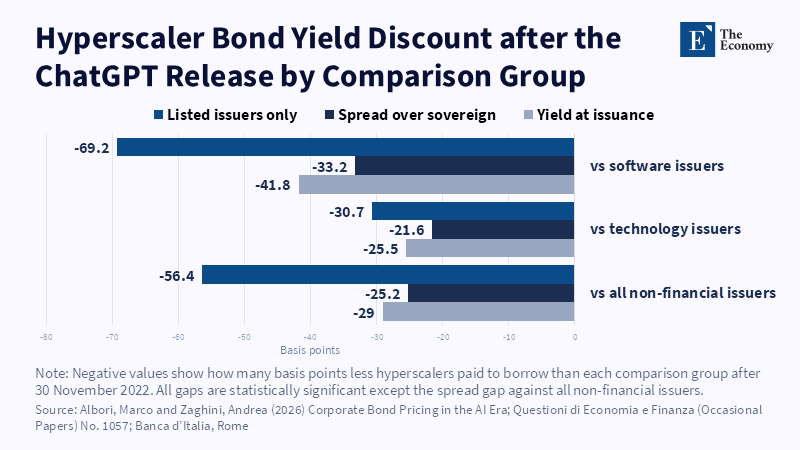
Hyperscaler Bond Yield Discount after the ChatGPT Release by Comparison Group
Picture

Real name
The Economy Graphics
Bio
The Economy Graphics is a dedicated visual research team for The Economy, responsible for producing high-quality data charts, analytical graphics, and visual summaries that support the publication’s coverage of global economic, financial, technological, and policy developments. Drawing on data from research articles, public datasets, institutional reports, and The Economy’s own research team, the account transforms complex information into clear, structured, and publication-ready visual materials.
Its work emphasizes accuracy, methodological transparency, and visual consistency across The Economy’s editorial ecosystem. By translating quantitative findings and research-based insights into accessible charts and data-driven visuals, The Economy Graphics serves as a foundation for The Economy Intelligence, helping readers understand market structures, institutional trends, and long-term economic shifts through evidence-based visual analysis.
Its work emphasizes accuracy, methodological transparency, and visual consistency across The Economy’s editorial ecosystem. By translating quantitative findings and research-based insights into accessible charts and data-driven visuals, The Economy Graphics serves as a foundation for The Economy Intelligence, helping readers understand market structures, institutional trends, and long-term economic shifts through evidence-based visual analysis.
Authored On
Modified
Related articles: AI Financing: The Bond Market Lends Cheaply to Infrastructure and Dearly to Implementation
Picture
Real name
The Economy Graphics
Bio
The Economy Graphics is a dedicated visual research team for The Economy, responsible for producing high-quality data charts, analytical graphics, and visual summaries that support the publication’s coverage of global economic, financial, technological, and policy developments. Drawing on data from research articles, public datasets, institutional reports, and The Economy’s own research team, the account transforms complex information into clear, structured, and publication-ready visual materials.
Its work emphasizes accuracy, methodological transparency, and visual consistency across The Economy’s editorial ecosystem. By translating quantitative findings and research-based insights into accessible charts and data-driven visuals, The Economy Graphics serves as a foundation for The Economy Intelligence, helping readers understand market structures, institutional trends, and long-term economic shifts through evidence-based visual analysis.
Its work emphasizes accuracy, methodological transparency, and visual consistency across The Economy’s editorial ecosystem. By translating quantitative findings and research-based insights into accessible charts and data-driven visuals, The Economy Graphics serves as a foundation for The Economy Intelligence, helping readers understand market structures, institutional trends, and long-term economic shifts through evidence-based visual analysis.
Similar Post