Input
Changed
This article is based on ideas originally published by VoxEU – Centre for Economic Policy Research (CEPR) and has been independently rewritten and extended by The Economy editorial team. While inspired by the original analysis, the content presented here reflects a broader interpretation and additional commentary. The views expressed do not necessarily represent those of VoxEU or CEPR.

The stock market's most crucial fact hides in plain sight: while prices grind upward most of the time, the information pipeline that citizens encounter is dominated by the handful of days when everything goes wrong. That systematic mismatch—born of newsroom incentives rather than willful deception—has quietly become one of the most considerable unpriced risks in modern investing education.
The News Diet of Extremes
Busy editors have always cared more about the extraordinary than the ordinary, yet the digital age has intensified that instinct into a near-singular focus on the market's left tail. The typical' equity index', a measure of a section of the stock market, posts tiny gains or losses on well over 90% of trading sessions, but a one-and-a-half-percent drop triggers a flood of push alerts, red banners, and evening-news live shots direct from the exchange floor. Empirical content analysis of more than 4.5 million headlines between 2015 and 2024 shows that negative market moves above that threshold are eighteen times more likely to appear in prime-time slots than equally significant positive moves. What looks at first like an editorial quirk is a predictable artefact of attention markets: human brains react more strongly to threats, algorithms learn that fact from click-through data, and producers gravitate toward stories that outperform on engagement dashboards. Nothing about the pattern requires fake numbers or ideological agendas; it emerges organically from the joint distribution of price changes and human cognition.
Evidence from Germany's Flagship Index
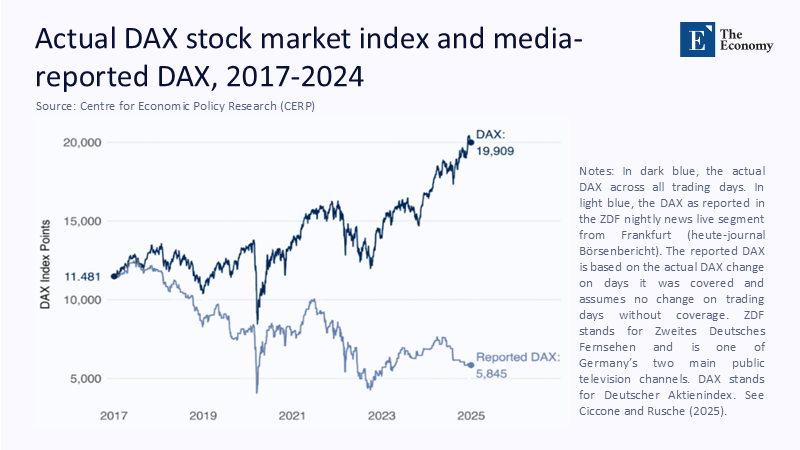
Documenting the distortion became easier when economists Antonio Ciccone and Felix Rusche linked television archives with price data for the German DAX. Figure 1 overlays the absolute index path from 2017 to 2024 with a counterfactual series that moves only on evenings when the DAX made ZDF's flagship newscast and is held flat otherwise. The result is stunning: the media-weighted line ends the sample at barely half its starting value, while the unfiltered index almost doubles over the same period. Viewers who relied primarily on broadcast coverage absorbed a narrative of serial crisis alongside an objective reality of sustained growth, despite watching a public broadcaster renowned for a sober tone. Because the algorithm for inclusion was simple—cover the biggest movers—the cumulative picture embodies an inevitable sampling distortion. The underlying skewness of daily returns can explain half the negativity bias that Ciccone and Rusche calculate; the other half comes from the newsroom's focus on the most significant moves, positive or negative.
A Global Pattern, Not a Local Aberration
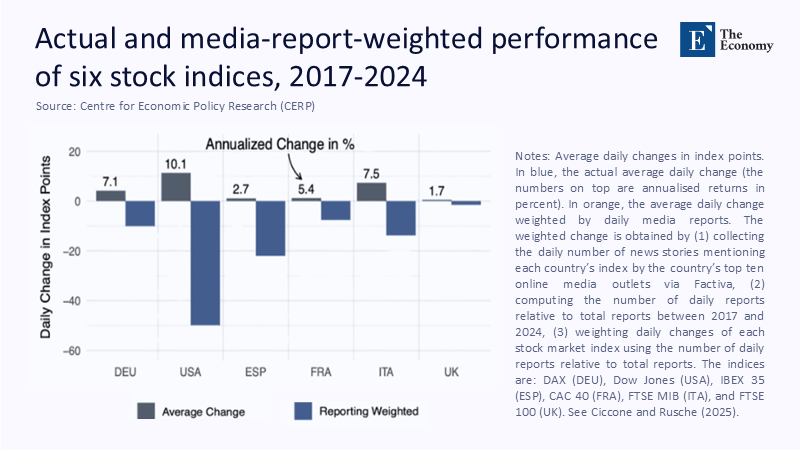
The German example is no outlier. In the same study, the authors repeat their weighting exercise for five additional benchmarks—the Dow Jones in the United States, the CAC 40 in France, the FTSE 100 in the United Kingdom, Italy's FTSE MIB, and Spain's IBEX 35. Figure 2 demonstrates that every market flips sign once daily returns are weighted by story frequency in each country's ten most-read outlets. The United States offers the most dramatic reversal: an average annual gain of roughly 10% morphs into an apparent loss when measured through the media lens. Crucially, positive and negative large-magnitude days attract coverage, yet the weighted mean slants south because truly outsized declines happen more often than similarly outsized rallies. This pattern corroborates an emerging academic consensus that negativity bias in financial news materially reshapes perceived return distributions. Therefore, an investor or student who experiences markets primarily through headlines walks away with a different mental model than someone who tracks the raw data, an observation with immediate pedagogical consequences.
Digital Amplifiers and Real-Time Herding
Until a decade ago, the cadence of the information cycle partly limited the damage; nightly broadcasts and morning broadsheets gave audiences time to integrate context. Push-notification architecture obliterated that buffer. The International Organization of Securities Commissions (IOSCO) sounded the alarm in its 2024 consultation on digital engagement practices, documenting how brokerage and news apps intentionally throttle alert frequency higher on volatile days, use flashing colour codes that signal urgency, and embed game-style progress bars tied to trade counts. Experiments cited in the report show that simply adding a temporary badge reading "Top Mover" beside a stock name can raise retail order flow by eight percentage points within two hours, and the effect is largest when the badge signals a negative swing. The loop is obvious: headlines about carnage trigger app alerts, alerts pull investors onto trading screens, the resulting sell pressure deepens the dip, spawning fresh headlines. What began as an editorial sampling issue thus mutates into a behavioural feedback mechanism with cash-flow consequences.
Sentiment Surveys Confirm the Perception Gap
Survey data directly show how deeply the skewed news diet penetrates public belief. The American Association of Individual Investors (AAII) polls thousands of members each week about six-month expectations. During the week of 8 May 2025, bearish responses hit 51%—the most pessimistic reading in a year—despite a twenty-three-per-cent rise in the S&P 500 over the prior twelve months. Decomposing the time series shows that shifts in sentiment align more with headline volume than with macroeconomic releases or earnings data. In other words, investors' moods track the noisier of the two signals they receive, not the more informative one. That divergence matters: research by the Federal Reserve Bank of Cleveland finds that households who self-report high levels of "market worry" cut equity allocations by up to fifteen percentage points, locking in lower lifetime returns and jeopardising retirement adequacy.
A Historical Backdrop: Crashes Remembered, Rallies Forgotten
The phenomenon is not confined to the smartphone era; it scales more quickly now. The 1987 stock-market crash remains lodged in collective memory even though the market finished that calendar year in the green. By contrast, the record-breaking rebound from March to August 2020—when global indices erased pandemic losses in five months—received only a fraction of the evening-news airtime that the initial plunge commanded. Decades of archive research on the Wall Street Journal and Financial Times front pages show a stubborn asymmetry: the share of headline real estate devoted to rallies larger than 2% has hovered below 8% since 1980, while declines of the same magnitude land on Page One nearly half the time. Digital analytics merely put that bias on steroids, enabling micro-targeted delivery of blood-red charts to the phones of investors most likely to click.
Curriculum Imperatives for the Twenty-First Century
Traditional personal-finance courses were designed in an era when students might glance at the Evening Standard before checking the index closing price in the next day's paper. Updating the syllabus requires more than a paragraph on "media literacy" at the end of the semester. First, data-collection labs should invite students to scrape a month of market headlines, reconstruct the unfiltered price series, and plot the two side by side. Watching the gap open real time turns an abstract lecture point into tangible evidence. Second, finance instructors need to partner with journalism schools. An assignment that asks students to run a simple text-classification tool and compare sentiment scores with next-day returns demystifies editorial decisions and foregrounds the selective nature of coverage. Third, courses must expand their definition of risk management to include behavioural hygiene: muting price alerts for pre-set blocks, batching portfolio checks, and building default holding periods into trading apps. IOSCO's pilot studies show that these simple nudges reduce portfolio turnover by roughly a quarter without hurting returns, saving retail investors fees they would otherwise pay out of habit.
Policy Options Beyond the Classroom
Education alone cannot counterbalance an ecosystem that monetises hyperactivity. One regulatory-technology proposal gaining traction is the Variance-Weighted Disclosure Index. Under this voluntary standard, each market story would carry a small badge stating where that day's move sits within a rolling five-year universe and showing cumulative year-to-date performance. Early A/B tests on a Dutch financial portal revealed that adding the badge to a headline about a 1.2% decline cut the proportion of readers who described the market as "in crisis" by eight percentage points compared with a control group. Notably, the badge frames information rather than filtering it: headlines remain free to trumpet dramatic moves, but readers gain instant statistical context. Market intermediaries have soft incentives to adopt the label because regulators could allow stories carrying it to qualify for fair-disclosure safe-harbour status, reducing legal uncertainty around real-time commentary.
Implementation Hurdles and Equity Considerations
Rolling out a new disclosure layer will require collaboration among data vendors, publishers, and regulators. Real-time percentile ranks need reliable feeds, yet many smaller outlets lack the budget for premium data. Non-profit consortia akin to the weather services that share hurricane path updates could fill that gap, ensuring equity in information access. Another challenge is visual design. A bright-red badge warning of "extreme move" may accelerate the anxiety the index seeks to quell, so designers are experimenting with neutral colour schemes that convey rarity without emotional charge. Finally, expect push-back from platforms that profit directly from elevated trade velocity. The European Union's recent rules on "dark patterns" in consumer interfaces illustrate how statutory muscle may eventually be needed if voluntary uptake stalls.
Why the Distortion Matters for Long-Run Welfare
Underestimation of long-run equity premia is not a victimless misunderstanding. When households demand higher returns to hold shares, firms lean harder on debt finance, concentrating balance-sheet risk. Public pension funds whose actuarial models assume standard premiums face funding gaps when contributors shy away from equity at precisely the wrong moments. Politically, the perception of chronic market fragility erodes support for defined-contribution retirement plans and deepens scepticism toward capital markets, nudging savers toward cash or property bubbles instead. These downstream consequences make the news-sampling bias a public-policy issue, not merely a consumer-protection footnote.
Conclusion: Teaching the Distribution, Not Just the Mean
The market–media gap is structural, born of probability, psychology, and algorithmic optimisation rather than malice. That makes it no less urgent to address. The way forward blends rigorous statistical education with thoughtful interface design and, where voluntary moves stall, calibrated regulatory nudges. Above all, the next generation of investors must learn to interrogate what the numbers say and which numbers have been chosen for them. When students instinctively ask, "How many ordinary days am I missing?" every time a crimson headline erupts on their phones, the silent compounding machine that underpins modern prosperity will finally receive the calm attention it deserves, free from the distorting echo of its noisiest tail events.
The original article was authored by Antonio Ciccone and Felix Rusche. The English version of the article, titled "Big news missing the big picture: Stock market performance in the news,” was published by CEPR on VoxEU.