Debt-at-Risk and America's Vanishing Margin of Error: The Consequences of Inaction

Input
Modified
This article is based on ideas originally published by VoxEU – Centre for Economic Policy Research (CEPR) and has been independently rewritten and extended by The Economy editorial team. While inspired by the original analysis, the content presented here reflects a broader interpretation and additional commentary. The views expressed do not necessarily represent those of VoxEU or CEPR.
Bond investors still treat U.S. Treasuries as the inert bedrock of modern finance. Yet, the distribution of future federal debt has quietly grown so fat-tailed that a single adverse shock could haul the public balance sheet into territory no reserve-currency issuer has ever navigated. The danger is not the headline ratio everyone quotes; it is the mass of probability piling up at the far right edge of that ratio's forecast—and the speed with which politics can push the country into that tail.
The Mirage of the Median
Every March, the Congressional Budget Office releases an orderly baseline, showing that federal debt creeps from roughly 100% of GDP today to 115% by 2035 and 156% by 2055. The figures are alarming but strangely serene, encouraging a political culture content to delay hard choices into the 2040s. The baseline conceals convexity: once gross debt clears the 100% line, shocks do not merely nudge the median outcome—they widen the whole distribution, lifting the 95th percentile far faster than the mean. The CBO publishes fan charts hinting at this dispersion, yet stops short of quantifying the tail. That omission leaves Congress to haggle over single-point projections that are mathematically incapable of explaining how crises begin.
From Point Forecasts to Distributions: The Debt-at-Risk Lens
Debt-at-Risk (DaR)—a concept introduced in a significant 2025 IMF working paper—fills that void by modeling the entire conditional distribution of future debt. This paper, a culmination of extensive research and analysis, has been widely recognized for its innovative approach to understanding and predicting future debt scenarios. Borrowing the intuition of bank Value-at-Risk, the framework asks, 'Where will the debt-to-GDP ratio be in five years?' but also, 'With 5% probability, how high could it reach?' Using a location-scale panel quantile regression across 123 economies, the authors show that tightening financial conditions raises future debt's location (the expected path) and the scale (the dispersion). The result is a thickening right tail that standard deterministic models miss. A companion VoxEU column applies the method to today's macro-financial backdrop and finds that global three-year-ahead DaR already sits almost twenty percentage points of GDP above the median.
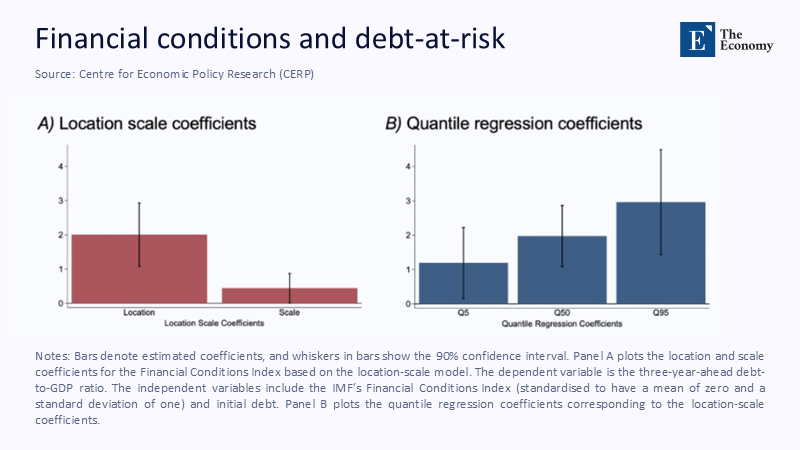
Because the United States begins the exercise with debt north of 100% of output and a history of policy brinkmanship, the scale effect dominates: every incremental recession, rate spike, or budget standoff fattens the tail by more than it shifts the average. The t is fiscal gamma—risk accelerating as a function of size, and it means the fundamental metric of prudence is how quickly policymakers can truncate the tail, not how slowly they manage the median.
What America's Tail Looks Like
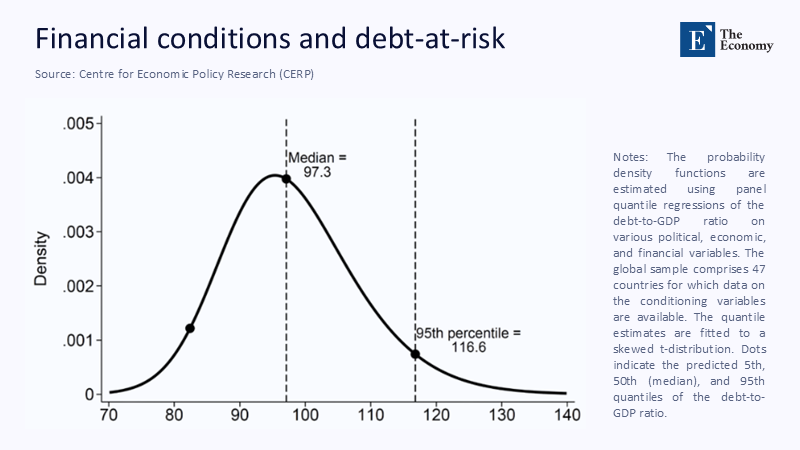
Feeding current U.S. data into the IMF model magnifies the picture. As ume real growth undershoots the CBO baseline by one standard deviation, primary deficits widen by 1.5% of GDP (roughly the gap between Clinton-era averages and today), and real interest rates remain a whole percentage point above their 2010-19 mean. Under those conditions, DaR places the 95th-percentile debt path at 135% of GDP by 2030, extends the horizon five more years, and crests at 152%—about $12 trillion more than the baseline, exceeding the current output of Japan. Interest in that tail scenario approaches the trillion-dollar mark before the end of the next presidential term and consumes a quarter of federal revenue by the early 2040s.
(Insert Figure 2 here)
The argument that "markets would never let it get that far" misreads recent evidence. In May 2025, as Congress flirted with adding another $2.4 trillion to deficits, ten-year Treasury yields jumped 29 basis points in forty-eight hours, and the S&P 500 shed almost 2%. This turbulence had nothing to do with the headline debt level, which did not move; instead, it reflected a rapid repricing of the tail once a legislative surprise made an extreme outcome seem slightly less remote. In DaR terminology, the scale parameter widened even as the location stayed put.
Politics as a Volatility Engine
Debt-ceiling showdowns are not one-off shocks but volatility engines that feed directly into DaR's scale term. When the Treasury resorted to "extraordinary measures" on 1 January 2025, five-year U.S. sovereign credit default-swap spreads jumped to their highest level since the 2011 downgrade scare. Although 56 basis points are still tiny by emerging-market standards, the spread was five times its 2019 average, and the policy-uncertainty indices that help drive the DaR regression spiked in tandem. An episode of brinkmanship leaves a residue in the debt distribution even when the default is averted because the memory of near-misses increases the perceived likelihood of a future misstep. During that time, residue compounds were raised, and the scale coefficient was one negotiation at a time.
Market Signals and the Term-Premium Loop
Tail risk is already leaking into borrowing costs through the term premium. Federal Reserve staff attribute roughly a third of the 130-basis-point rise in the ten-year nominal yield since early 2023 to an expanding premium rather than to changes in expected short-term policy rates. As the fiscal outlook worsens, the must-warehouse duration shrinks while the Fed reduces its holdings. The feedback is self-reinforcing: large deficits increase private-sector duration supply, fattening the scale term; the wider tail pushes up the premium; the higher premium feeds into DaR by elevating the effective interest rate, raising the scale again. At some threshold, the Fed will choose between capping yields, risking fiscal dominance, or letting rates climb, thereby inflating DaR through the interest-rate channel. Their route redistributes probability toward crisis.
Why Japan and Italy Are the Wrong Analogies
Optimists point to post-war Britain, 1990s Japan, or present-day Italy as proof that high debt need not breed instability. That reveals the flaw: the analogy breaks down once rollover risk, investor mix, and duration profile are included. Japan's weighted average maturity is over nine years, and the debt is domestically held; Italy benefits from a European Central Bank backstop. The United States, by contrast, must refinance about one-third of its marketable debt within three years, and foreign investors hold roughly 30% of outstanding Treasuries. Treasury's own Borrowing Advisory Committee projects that, under current issuance patterns, weighted-average maturity will drift slightly lower through 2027 if Treasury bills continue to absorb cyclical financing needs. A higher maturity elevates the gamma of the debt ratio, magnifying rate shocks in the DaR equation.
The Educational Dividend: Teaching Risk Literacy
DaR has implications not just for policy but for pedagogy. Undergraduate public finance curricula still teach debt dynamics as a deterministic identity—primary balance plus interest-growth differential equals tomorrow's ratio. A distributional approach shows students that what matters is not only the expected value but the variance and skewness around it. By using live data from the Treasury's FiscalData portal, the Atlanta Fed's Financial Conditions Index, and policy uncertainty trackers, students can replicate debt-to-GDP (DaR) estimates. For example, they can observe that a one-percentage-point decline in the primary balance increases the median debt ratio by two points, and in some cases, it can raise the 95th percentile by as much as six points. When future staffers arrive on the Hill armed with that intuition, debates will shift from "What is the number?" to "How thick is the tail—and which lever trims it most efficiently?"
Blueprint for a U.S. Fiscal VaR Regime
Institutionalising DaR would entail three low-cost reforms. First, the Treasury's Office of Debt Management and the CBO should co-produce a quarterly Debt-at-Risk dashboard, updated with high-frequency macro and market inputs. Second, the Financial Stability Oversight Council must integrate sovereign-tail scenarios into bank stress tests, ending the convenient fiction that Treasuries are always risk-free. Third, Congress should legislate an automatic stabilizer keyed to DaR: if the five-year 95th-percentile ratio breaches 140% of GDP, pre-agreed revenue and spending measures phase in over three years, akin to the Swiss debt brake but calibrated to risk rather than level. Far from surrendering fiscal sovereignty to an algorithm, such a rule would make delay transparent: voters and markets would see immediately how each postponed decision widens the tail.
Clip the Tail Before It Wags the Dog
Reserve-currency privilege and deep markets buy America time but not immunity. A decade ago, the 95th-percentile debt path sat scarcely ten points above the baseline; today, the gap is triple that and accelerating. This quantifies the cost of complacency and turns "future generations" rhetoric into a present-day probability distribution. Acing early—front-loading primary balance improvements, extending the maturity profile, and depoliticizing brinkmanship—would shrink the tail while the insurance price is still low. Once the upper percentiles materialize in spreads and term premia, the margin of error will vanish quickly, and choices will narrow to austerity or inflation. This lesson is, therefore, brutal in its clarity: the longer policymakers wait to trim the tail, the more likely that tail is to become fate.
The original article was authored by Davide Furceri, a Division Chief, in the Fiscal Affairs Department at the International Monetary Fund, along with four co-authors. The English version of the article, titled "Quantifying global debt risks amid high and rising public debt," was published by CEPR on VoxEU.
References
Congressional Budget Office. The Long-Term Budget Outlook: 2025–2055. Washington, DC, March 2025.
Edelberg, W., Harris, B., & Sheiner, L. "W at Are the Risks of a Rising Federal Debt?" Brookings Institution, February 2025.
Furceri, D. et al. "Quantifying Global Debt Risks Amid High and Rising Public Debt." VoxEU/CEPR column, 17 June 2025.
Furceri, D., Giannone, D., Kisat, F., Lam, R., & Li, H. "D bt-at-Risk." IMF Working Paper 2025/086, May 2025.
Reuters. "F tch Cuts U.S. Credit Rating to AA+; Treasury Calls It 'Arbitrary'." 1 August 2023.
Reuters. "Policy Uncertainty Fuels Rise in U.S. Government Debt Hedging." 9 May 2025.
U.S. Treasury Borrowing Advisory Committee. "P presentation to the Secretary." First Quarter 2025.