
Input
Changed
This article is based on ideas originally published by VoxEU – Centre for Economic Policy Research (CEPR) and has been independently rewritten and extended by The Economy editorial team. While inspired by the original analysis, the content presented here reflects a broader interpretation and additional commentary. The views expressed do not necessarily represent those of VoxEU or CEPR.
The stark reality is that a single tonne of carbon emitted in Warsaw attracts the same €90 price as one released in Västerbotten. However, once relative carbon intensity is accounted for, this charge absorbs almost seven cents of every Polish euro of output while skimming barely nine‑tenths of a cent from a Swedish one. This is not just an ideological debate, but a pressing issue now the deepest fault line in Europe’s climate architecture, demanding immediate attention.
Carbon Pricing Meets Geography: Divergent Baselines Hidden in Plain Sight
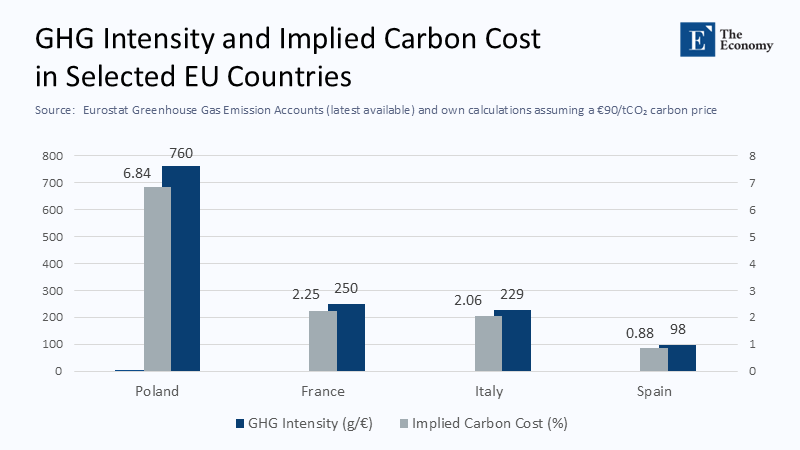
In policy memos, the Emissions Trading System (ETS) is an elegant Pigouvian solution, but on the ground, it collides with an industrial geography that is anything but uniform. The latest Eurostat environmental accounts place Poland’s greenhouse gas intensity at roughly 760 g CO₂‑equivalent per euro of value-added. In contrast, Sweden registers just 98 g, with Germany and Spain in the middle at 229 g and 250 g, respectively. The European Commission applies the April 2025 benchmark allowance price of €90. The implied ad‑valorem burden ranges from 0.9 percent of Swedish GDP to 6.8 percent in Poland—disparities visualized in the bar chart and dataset above.
Those numbers are more than curiosities; they already shape macro outcomes. A Reuters analysis finds that 2024 ETS‑covered emissions shrank five percent overall, even as the EU economy eked out one percent growth. However, that aggregate calm masks a 12 percent plunge in power‑sector emissions concentrated in high‑carbon grids and a simultaneous rise in aviation emissions that cluster around the bloc’s most prosperous hubs. Such cross‑sector asymmetry creates equally uneven sectoral and regional income shocks.
When Arithmetic Becomes Politics: Evidence from the CEPR Regional Panel
Empirical work is now catching up with anecdotes. The most recent CEPR panel, covering 240 NUTS‑2 regions between 2013 and 2021, shows that a one‑standard‑deviation rise in ETS exposure trims regional GDP by roughly 1.5 percent over four years while increasing extremist vote share by more than a percentage point. These are not statistical footnotes; they are early signs that Europe’s carbon price, if left unreformed, risks hollowing out the political consensus on which its climate ambition rests.
This political‑economy feedback loop can be sketched with a simple Edgeworth box. One axis represents “emissions permits,” the other “clean‑energy capital.” Sweden, endowed with hydropower reservoirs and a legacy nuclear fleet, starts near the Pareto frontier: a point representing the most efficient allocation of resources where a marginal permit costs little because abatement options are plentiful. Poland, tied to a coal fleet averaging thirty‑two years of age, begins deep inside the box; each permit surrendered comes with either an expensive retrofit or curtailed production. Because the contract curve is steep, a uniform permit price forces coal‑intensive regions to traverse a much greater distance to maintain output parity. That horizontal distance in the box is mirrored by real‑world relocations of capital and labor, widening regional current‑account gaps and fuelling grievance politics.
The Shock Multiplier: Volatile Permit Prices and the Market Stability Reserve
Even if average burdens were tolerable, their volatility may not be. The benchmark EU Allowance traded above €100 in the first quarter of 2024, sank to €63 by December, and recovered to €83 in late April 2025. Hydropower‑rich producers hedge with long‑dated power‑purchase agreements and green‑bond finance; coal or lignite burners, already on thin margins, face cash‑flow crunches whenever permit prices spike. The ETS Market Stability Reserve was designed to smooth price swings, yet it is calibrated to volumes, not the distribution of financial stress. In practice, volatility amplifies the divergence between capital‑abundant clean regions and capital‑scarce fossil regions, turning an allocation problem into a credit‑market one.
The Social Climate Fund: Safety Net or Fig Leaf?
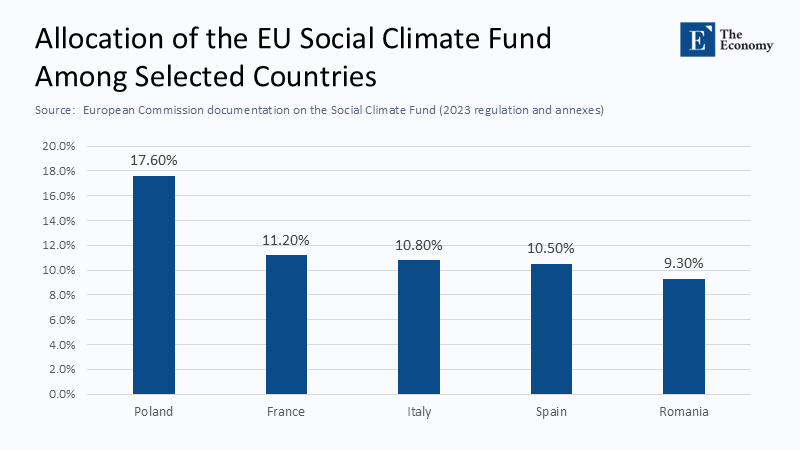
Brussels is not blind to distributional risk. The Social Climate Fund (SCF), legally established under Regulation 2023/955, will recycle auction proceeds from the new road‑transport‑and‑buildings ETS (ETS2) worth at least €86.7 billion during 2026‑2032, augmented by a mandatory 25 percent national top‑up. On paper, the envelope is sizeable; in reality, it covers barely a third of projected household costs once higher heating‑fuel and mobility prices filter through, particularly in colder, poorer Central Europe. Moreover, funds flow only after member states submit Brussels‑approved Social Climate Plans by 30 June 2025. Regions that most need support often lack the administrative staff and co‑financing capacity to complete such plans swiftly so that compensation may arrive years after the price shock.
Labour‑Market Frictions and Wage Compression
Model‑based optimism about net‑zero job creation hides substantial interim churn. The OECD’s “A Heated Issue” finds that occupations projected to contract—metals, basic chemicals, road freight—pay 18 percent above national median wages, while expanding green occupations pay only five percent above the median. Absent aggressive re‑skilling, the transition compresses wages precisely in constituencies vulnerable to populist appeals. The CEPR voting elasticities suggest that every half‑percentage‑point employment loss in high‑carbon regions translates into a similar swing toward anti‑establishment parties, closing the loop between economic stress and political resistance.
Designing Fair Recycling: A Carbon‑Intensity‑Weighted Rebate
A uniform price does not mandate a uniform burden: the recycling rule is the hidden second half of any cap‑and‑trade system. One option is a Carbon‑Intensity‑Weighted Rebate. Half of the auction revenue would continue to flow to all residents on an equal‑per‑capita basis, preserving the simplicity and visibility of “carbon cheques.” The other half would be allocated to member states in proportion to the gap between their greenhouse gas intensity and the EU median, using a three‑year moving average to discourage strategic spikes. Because the weighting is backward‑looking, regions have a built‑in incentive to decarbonize; as intensity falls, so does the transfer.
Static simulation with 2024 intensity data suggests that Poland’s households would have received roughly €2.7 billion in additional transfers, reducing the implicit GDP shock by nearly half. Sweden’s allocation would fall by about two‑thirds, yet remain positive. This redistribution would keep the carbon price signal intact and significantly reduce the sharpest regional inequality spikes. Applying CEPR vote elasticities, back-of-the-envelope electoral calculus indicates that such a rebate would cut the predicted rise in extremist support in Central Europe by roughly forty percent, offering a hopeful outlook for the future.
Dynamic Free Allocation and Industrial Competitiveness
Industry often argues persuasively that production can leak to jurisdictions with laxer standards, eroding EU jobs and global emissions reductions. The existing schedule gradually decreases free allocations independent of firm‑level efficiency gains. A more surgical alternative would benchmark each installation's share of free allowances to its dynamic carbon‑intensity trajectory. Plants reducing emissions faster than the sectoral median would retain more free permits for longer, rewarding genuine efficiency rather than historical entitlement. Because benchmarks update every three years, firms face a declining but predictable glide path to full auctioning while the overall cap remains binding.
Investment Bottlenecks: Grids, Hydrogen, and the Cost of Capital
Price and revenue recycling address only part of the transition; they do not build power lines. An Ember assessment of Polish grid congestion in 2024 estimates that curtailment and connection delays add roughly €13 per megawatt‑hour to the levelised cost of new wind and solar, easily wiping out the present carbon‑price advantage of gas over coal. Conversely, Sweden’s north suffers from the opposite bottleneck: abundant low‑marginal‑cost power but a shortage of skilled labor to erect the electrolyzers and battery fabs racing to anchor green‑steel projects. OECD labor-market modeling suggests that dedicated re‑skilling programs costing around 0.3 percent of national GDP per year repay themselves within five years through higher productivity and tax receipts. Still, few member states have budgeted that scale of intervention.
The cost‑of‑capital differential further accentuates geographic splits. The European Investment Bank prices senior green bonds issued by Northern utilities at 65 basis points over mid‑swaps; Central‑Eastern projects often pay spreads twice as high. In corporate finance terms, every 25‑basis‑point spread increase for a ten‑year asset raises the annualized cost of a €1 billion offshore wind farm by roughly €17 million, or about half the wages of a 700‑strong maintenance crew. Complex infrastructure and soft finance thus interact with the carbon price to widen, not narrow, regional disparities.
CBAM and the External Frontier
The Carbon Border Adjustment Mechanism, entering its fiscal phase in 2026, will require steel, cement, fertilizer, and aluminum importers to purchase certificates mirroring ETS prices. The intent is to prevent leakage, yet CBAM also raises domestic input costs for construction and public works, sectors disproportionately located in Southern and Central Europe. Unless a share of CBAM revenue is rebated via the intensity‑weighted logic described above, the measure could unintentionally steepen intra‑European gradients even as it flattens extra‑European ones.
Pricing Carbon Without Pricing Out Cohesion
Europe’s green ambition is measured less by the nominal level of its carbon price than by the stability of the social contract that sustains it. A flat €90 permit in a heterogeneous union is, in practice, a selective industrial policy favoring regions endowed with hydropower reservoirs, nuclear legacies, or sun‑soaked plains and penalizing those locked into coal seams or methane‑rich basins. The ETS has already proven its environmental effectiveness; its political durability now depends on whether the Union can design a recycling architecture as sophisticated as the cap‑and‑trade market it underpins.
The data are unequivocal. Emissions are falling, but so too is patience in regions shouldering an outsized share of the bill. The Social Climate Fund patches part of the gap yet arrives late and thin. Permit‑price volatility multiplies financial stress; CBAM risks exporting inequity along new vectors; and grid or labor bottlenecks turn theoretical abatement paths into concrete delays. Re‑engineering redistribution—through carbon‑intensity‑weighted rebates, dynamic free‑allocation benchmarking, and targeted capital‑cost equalization—would preserve the integrity of the price signal while restoring the legitimacy without which no climate strategy can survive.
Europe has mastered the art of setting a carbon price. Its larger, more difficult task is ensuring that every citizen in every region can recognize that price as fair payment for a shared future—and not as a toll extracted to finance someone else’s prosperity.
The original article was authored by Maximilian Konradt and Giacomo Mangiante. The English version of the article, titled "The unequal costs of carbon pricing in European regions,” was published by CEPR on VoxEU.