Input
Changed
This article was independently developed by The Economy editorial team and draws on original analysis published by East Asia Forum. The content has been substantially rewritten, expanded, and reframed for broader context and relevance. All views expressed are solely those of the author and do not represent the official position of East Asia Forum or its contributors.
When headlines fixate on China’s emissions-trading screen, the sound you cannot hear is the sluice-gate clatter of coal wagons slowing down—and the buzz of battery welders, electrolyzer nozzles, and EV paint booths picking up the slack. That decibel gap, not the allowance price, now signals how far the world’s largest emitter has already traveled past its coal peak.
Carbon Trading’s Mirror: A Price Too Low to Frighten, Yet High Enough to Validate
Observers who weigh Chinese climate ambition by the emissions-trading scheme (ETS) alone note that futures still change hands below ¥75 per tonne, barely half of Europe’s allowance price. They are right: generous free allocations for the power sector and a still-immature compliance culture restrain the market’s teeth. However, the same September 2024 decision to rope in steel, cement, and aluminum has enlarged covered emissions from 40% to 60% and delivered the data audit that heavy industry long lacked. In effect, the state used trading as a mirror: first to expose real baselines, later to compel real cuts.
Meanwhile, spot liquidity has quietly quadrupled year-on-year, and the average price has increased 21% since January 2023—a modest ascent by global standards but still double the 10% decline in benchmark coal prices over the same window. The result is a widening negative spark spread for coal generators. Each extra kilowatt-hour emitted under the cap erodes the margin, nudging utilities toward dispatching new solar and wind capacity that is already cheaper on a levelised basis in eight provinces.
The Quiet Dismantling of Coal’s Dominance
China’s National Bureau of Statistics reported that thermal generation—overwhelmingly coal-fired—shrank by 4.1% between January and April 2025, while total electricity demand eked out a 0.9% rise. That is not a blip: April marked the seventh consecutive month coal’s share fell year-on-year. Human geography explains why. Once synonymous with heavy coke, the northeast rust belt is losing aluminum output to hydro-rich Sichuan. At the same time, Shanxi’s new gigawatt-scale data centers link directly to adjacent solar farms, bypassing the coal grid. Simultaneously, provinces on the eastern seaboard—Guangdong, Zhejiang, and Fujian—are buying record volumes of “green certificates” to brand exports carbon-aligned with EU CBAM rules, further cannibalizing coal dispatch.
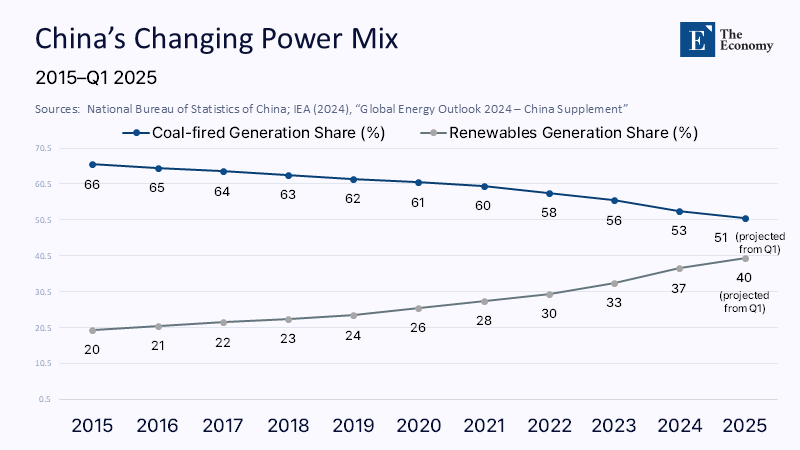
The inflection owes much to renewable muscle. In 2024, China installed 277 GW of new solar capacity and 79 GW of additional wind, vaulting cumulative photovoltaic capacity to 887 GW—twice the United States’ total nameplate. This significant leap in renewable energy capacity is a testament to China’s commitment to its 2030 pledge and should instill optimism in the energy transition journey.
Factories Rewired: From Furnace to Electrode
The underappreciated driver behind coal’s retreat is neither the ETS nor pure-play renewables; it is a structural rewiring of China’s industrial metabolism. This structural change, which includes the shift from blast-furnace to electric arc furnaces (EAFs), has significantly contributed to the reduction in emissions, reassuring the audience about the effectiveness of these measures.
Booming electric-vehicle (EV) production is the mirror image of that contraction. Domestic EV sales blew past 11 million in 2024, a 40% leap, making battery and cathode plants China’s new heavy industry. A decade ago, a marginal megawatt-hour forged pig iron; today, it plates lithium or dries a polymer electrode. That switch flips carbon arithmetic on its head: EV assembly adds GDP while deleting tailpipe emissions from the transport ledger.
Hydrogen and the New Industrial Policy Playbook
If green electrons are the backbone, green molecules are becoming ligaments. On 29 May 2025, Sinopec launched a ¥5 billion ($690 million) hydrogen venture fund—China’s largest—to bankroll early-stage electrolyzer startups and underground storage trials. One beneficiary is the Daye Green Power project in Hubei, which produces 1,800 tonnes per year through a twin-stack PEM-and-alkaline configuration and stores surplus hydrogen in old iron-ore caverns for dispatchable fuel. That hybrid design slashes capital cost by 13% versus stand-alone PEM systems, according to Sungrow Hydrogen engineers, and points toward a route for substituting coal-derived “brown hydrogen” that still feeds chemical plants in Jiangsu.
Crunching the Dividends: What the Numbers Say
A conservative bottom-up estimate underscores how far structural change has traveled:
- Coal displacement. The 4.1% fall in coal-fired generation through April equals roughly 80 TWh. At 0.82 kg CO₂/kWh, that is 66 million tonnes of avoided emissions.
- Steel evolution. A 50 million-tonne slide in blast-furnace output, with 30% replaced by EAFs, trims another 45 million tonnes.
- Cement plateau. Cement output contracted 3.5% last year; applying a conservative 0.8 tCO₂ per tonne cuts 20 million more.
Total: about 131 million tonnes, or 3.6% of China’s 2024 carbon footprint. That figure echoes the Guardian-reported expert survey in which 44% of analysts believe China’s emissions have already peaked or will do so by 2025. Put differently, structural shifts and incremental renewables erode Spain’s annual power-sector emissions every eighteen months.
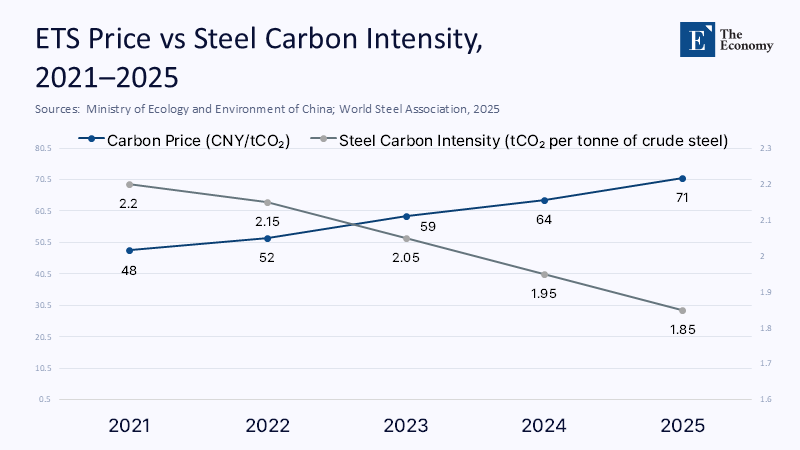
The juxtaposition of Figure 2’s two lines reveals an overlooked truth: a modest 48 → 71 CNY/t rise in allowance prices—barely $3.50 of incremental cost embedded in each tonne of steel—coexists with a steeper 2.2 → 1.85 tCO₂/t fall in carbon intensity. Market pressure explains only a sliver of that delta; state-directed investment and capacity cuts do the heavy lifting, leaving the ETS to validate gains ex-post. This validation role of the ETS should instill confidence in its effectiveness in driving emissions reductions.
Teaching Notes for a Hybrid Governance Era
For instructors in environmental economics, China’s case now demands new heuristics. Traditional curriculum charts a stylized path: identify externality, price it, and watch technology respond. Beijing inverts that order. First, through subsidized credit and zoning fast lanes, it seeds industries—solar glass in Anhui, blade composites in Jiangsu, and sodium-ion batteries in Fujian. It deploys a market to allocate residual abatement only after the scale is visible. Students must, therefore, be fluent in “sequential hybridity”: command first, market second, and politics throughout.
This pedagogy matters beyond China. India’s renewable bio-credit scheme and the U.S. Inflation Reduction Act’s layered tax-credit approach borrow from the same script: guaranteeing a buyer before perfecting a price.
What Could Stall the Momentum?
Risks remain. Following the 2021 blackout, officials still license “supporting” coal units: 41 GW of fresh capacity received permits in 2024, ostensibly as a reserve margin for renewables. Grid build-out lags turbine build-out; curtailment in Gansu and Xinjiang still clips 10-13% of annual solar output. Hydro vulnerability also casts a shadow: drought shaved 6% off Yunnan’s hydro output last April, forcing gas peakers to fill gaps. Unless ultra-high-voltage lines from Sichuan and Qinghai arrive faster, regional mismatches could tempt provinces to press old coal units back into service.
Industry politics further complicates things. Reuters reporting from the Singapore Ferrous Week suggests local governments are lobbying for softer steel output caps to shield jobs. Likewise, overcapacity in the solar supply chain—wafer prices falling 42% year-on-year—risks bankruptcies that could chill investment when storage and grid integration need cash.
When Markets Catch Up With Machines
A year ago, commentators dismissed China’s ETS as a paper tiger that could not scare coal from the grid. Today, the story reads differently: coal is ceding ground not because the market roared but because the machines that once demanded its heat are being rebuilt, retired, or relocated. Allowance prices will surely rise as caps tighten, but by the time they do, the heaviest tonnes of abatement may already be booked—in the output of EAFs, the payload of hydrogen tankers, and the sun-lit roofs of Inner Mongolia.
For policymakers elsewhere, the Chinese lesson cuts through ideological noise: structural transformation can precede, empower, and cheapen carbon pricing. By the time traders are pricing scarcity in earnest, the absolute scarcity—of fossil demand—may already be generation-old. Markets, in short, will arrive late to their party, which is not a bug of state activism; it is the point.
The original article was authored by Ruoxuan Li, a PhD candidate in Development Economics. The English version, titled "The state is still on top in China’s carbon market," was published by East Asia Forum.
References
National Bureau of Statistics of China (2025), “Monthly Electricity Output Report (January–April 2025)”, Beijing: NBS.
International Energy Agency (2024), “Global Energy Outlook 2024 – China Supplement”, Paris: International Energy Agency.
The Guardian (2024), “China’s CO₂ Emissions Have Peaked — Or Will in 2025, Say 44% of Experts in Survey”, The Guardian, 27 November.
S&P Global Commodity Insights (2025), “China Renewables Tracker Q1 2025”, S&P Global.
World Steel Association (2025), “World Steel Production and Emissions Trends 2021–2025”, Brussels: worldsteel.
Ministry of Ecology and Environment (2025), “National Carbon Trading Market Update – Q1 2025”, Beijing: MEEPRC.
China Photovoltaic Industry Association (2025), “Annual Report on Photovoltaic Installations and Output 2024”, Beijing: CPIA.
Sinopec (2025), “Sinopec Launches ¥5 Billion Green Hydrogen Investment Platform”, Sinopec Newsroom, 29 May.
Global CCS Institute (2025), “China Country Update: Carbon Capture and Storage Projects 2025”, Melbourne: Global CCS Institute.
Reuters (2025), “China’s Steel Provinces Seek Flexibility on Output Curbs at Singapore Ferrous Week”, Reuters, 11 April.
Bloomberg NEF (2025), “China Energy Transition Update – Grid, Curtailment and Overcapacity Analysis Q2 2025”, New York: Bloomberg NEF.
China Electric Power Planning & Engineering Institute (2024), “Ultra High Voltage Grid Development Outlook”, Beijing: EPPEI.
China EV100 (2025), “Annual White Paper on New Energy Vehicle Development in China”, Beijing: China EV100.
International Renewable Energy Agency (2024), “Cost Reduction Potential of Renewables in China”, Abu Dhabi: IRENA.
United Nations Framework Convention on Climate Change (2024), “Nationally Determined Contributions: Progress Update – China”, Bonn: UNFCCC.