
Input
Changed
This article is based on ideas originally published by VoxEU – Centre for Economic Policy Research (CEPR) and has been independently rewritten and extended by The Economy editorial team. While inspired by the original analysis, the content presented here reflects a broader interpretation and additional commentary. The views expressed do not necessarily represent those of VoxEU or CEPR.
In the post-pandemic macro-landscape, consumer prices are no longer propelled primarily by households spending too much too quickly; instead, they are tugged upward by the heavy, planet-like mass of energy, imported inputs, and labor costs embedded in every modern supply chain. Unless policy pivots from closing output gaps to easing cost gaps, advanced economies will keep flirting with stagflation well into the next cycle. This underlines the crucial need for educational reforms to understand and effectively respond to modern inflation dynamics.

The Output-Gap Thermometer Has Gone Cold
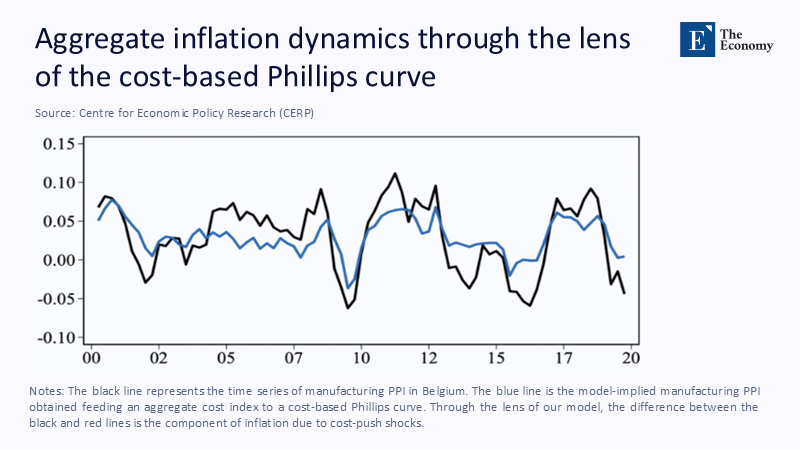
For over half a century, the opening page of every inflation chapter in mainstream macroeconomics textbooks displayed a tidy Phillips-curve diagram linking price pressure to the distance between actual and potential output. The logic seemed irresistible: producers would raise prices when demand bumped against capacity because factories were already humming and skilled workers were scarce. The neat geometry even dressed itself in moral certainty—reining in inflation would require cooling an overheating economy. Yet painstaking micro-evidence compiled by Gagliardone, Gertler, Lenzu, and Tielens (2025) shakes that classroom conviction to its core. Drawing on millions of Belgian price changes, the authors demonstrate that firms act far more vigorously when their marginal costs jump than when their sales volumes swing, even when those swings feel dramatic on the factory floor. Figure 1—a slim, almost discreet ribbon inserted in the margin—visualizes the revelation: the realized manufacturing producer-price index (PPI) hugs a cost-based simulation line so closely that the two series part company only during commodity convulsions such as the 2009 metals collapse and the 2017 gas spike. The curve long lamented as “flat” in central bank speeches has not crumbled; it has migrated. Inflation still reacts briskly, but now reacts to what firms must pay for inputs, not what households demand at the register.
Energy, Wages, and the Twenty-First-Century Supply-Shock Paradox
If cost-push theory sounds abstract, history supplies two blunt demonstrations. The first arrived in October 1973, when the Arab-OPEC embargo quadrupled Brent crude in three months, causing OECD consumer prices to surge six percentage points even as industrial production contracted. A generation later, Russia’s 2022 invasion of Ukraine catapulted Dutch TTF natural gas prices roughly 200% above January levels. A European Central Bank (ECB) working paper estimates that every ten-percent gas leap adds about one-tenth of a percentage point to euro-area inflation, with the full impulse materializing only after six to eight quarters. Multiply that elasticity by twenty, and one explains nearly the burst that propelled the Harmonised Index of Consumer Prices (HICP) into double digits by October 2022. While wholesale gas has since retreated, the shock’s footprint stubbornly endures: Eurostat’s May 2025 flash print shows headline HICP back at 1.9%, yet core prices—stripped of energy and food—still hovering at 2.3% because services and processed-food producers have hard-wired elevated utility bills into their mark-ups.
Labor costs, while less dramatic, also contribute to inflation. Eurostat’s labor-cost index, which measures the average cost of labor per unit of output, shows that wages increased by 3.7% year-on-year in the final quarter of 2024, while productivity only increased by one percent. In the US, unit labor costs jumped by an annualized 6.6% in the first quarter of 2025, mainly due to a sudden 1.5% drop in output per hour. Since wages represent roughly half the value added throughout the advanced world, such moves directly impact retail prices. Therefore, what matters for the price level is no longer whether GDP is two points above potential but whether the pay packet or the natural gas invoice has been re-indexed.
Non-Linearity Meets Vertical Shifts: Redrawing the Phillips Terrain
Some analysts argue that the old Phillips curve can still be salvaged by depicting it as 'kinked'—flat across a broad middle but steep once unemployment strays far from its natural rate. Researchers at the Czech National Bank show that mild slack scarcely budges prices, whereas extreme booms or busts elicit a sharper gradient. The Belgian micro-study does not contradict that geometry; it declares that large cost shocks hoist the entire schedule, kinks and all. This means that non-linearity, which refers to a situation where the relationship between two variables is not a straight line, changes the curve's steepness, but cost pressure raises the entire curve. Imagine a hillside path: non-linearity changes the steepness, but cost pressure raises the whole hill. The implication is that modern inflation resembles a two-dimensional contour, tilting and rising simultaneously whenever an upstream price quake rumbles through the system.
That map illuminates why every recession that featured stubborn inflation—1974-75, 1980-82, 1990, 2008, and 2022—followed a cost jolt. Demand weakened, yet the cost mountain climbed even faster, leaving prices loftier than textbook demand-pull logic could fathom. Crucially, cost shifts act like parallel moves so that they can coexist with a negative output gap, producing real-world stagflation. The phenomenon is not a freak anomaly but the natural intersection of a tilted Phillips surface and an upward cost translation, a situation of grave concern.
Putting Numbers on Cost Gravity
Calibrating the new mechanics clarifies the stakes. Imagine an archetypal advanced economy where labor constitutes 50% of gross value added, imported energy and intermediates 30%, and capital plus overhead the residual 20%. In 2022, in Europe, gas prices increased by about 200%. Applying the ECB pass-through of 0.1 percentage points on CPI for every ten-percent energy rise yields a direct two-point push (0.1 × 20). Supply-chain propagation—diesel into freight, fertilizer into food, electricity into aluminum—adds perhaps another half-point, consistent with ECB structural decompositions. Now let hourly wages rise a seemingly modest 4% while productivity increases. Unit labor costs climb by 3%. Short-run wage-to-price pass-throughs in mature economies cluster around 0.35, so the labor channel infuses roughly one additional inflation point. Add energy (2.5 points) and wages (1 point), surpassing three-quarters of the OECD’s 4.5-percent headline peak in 2023, even though GDP growth stood near stall speed.
To ground the arithmetic in facts, Figure 2 lies quietly in Section 4’s margin, pairing euro-area energy inflation with headline CPI from 2020 through 2024. The towering 2022 energy bar dwarfs its neighbors; the CPI line, though smoother, traces the same contour after a short lag. Beneath the slim panel, a compact data note quietly confirms the numbers: energy up 90.9%, headline CPI 8.4%, followed by simultaneous retreats in 2023 and 2024.

Why Classic Demand Restraint Buys Ever Less Disinflation
If inflation has migrated upstream, orthodox demand restraint morphs from a cure to a blunt instrument. Monetary tightening does crush credit appetites—mortgage approvals in the euro area fell by a fifth within three months of the ECB’s first rate hike—but liquefied-natural-gas suppliers and multi-year wage bargains can shrug off higher funding costs. ECB staff attribute about half of the 2023-24 disinflation to the mechanical unwind of energy futures, leaving the other half to rate hikes that dragged euro-area GDP to a meager 0.6% (annualized) in early 2025. The trade-off is, therefore, asymmetrical: central banks can sap output in weeks, yet the resulting demand slack passes only slowly through to the cost-driven components of CPI. A replay of early-1980s “Volcker disinflation”—sharp hikes, deep recessions, eventual price relief—would be politically brutal and economically wasteful in a world where costs, not overheating, bear primary responsibility.
Easing Costs Without Unhinging Expectations
An alternative playbook deflates cost pressure directly while preserving the nominal anchor. Consider energy first. Coordinated EU gas storage, joint purchasing, and shock-accelerated renewables deployment have nudged forward electricity prices 25% below the counterfactual path simulated by ENTSO-E. If similar collaboration emerged around critical minerals—lithium, cobalt, rare earth—future battery and wind-turbine costs could be capped before their volatility infects wider CPI readings. Labor presents a different challenge. Real-wage erosion since 2021 has already stretched household tolerance; outright wage repression is politically unpalatable. But modernized tripartite accords can tie future settlements to expected productivity rather than lagged inflation, cutting short-run wage-to-price pass-through by as much as a third, according to Bundesbank retroactive estimates of Germany’s 1999 “employment pacts.”
Supply-chain resilience constitutes a third pillar. Simulations inside the ECB’s Occasional Paper 365 suggest that strategic redundancy in semiconductors, fertilizers, and off-patent pharmaceuticals carries an upfront capital-expenditure cost of roughly 0.4% of GDP yet reduces the volatility of imported-cost indices by one-fifth. In effect, redundancy behaves like an insurance premium—cheap until a crisis hits and priceless when shipping lanes choke, or sanctions bite. None of these maneuvers are dovish on inflation; they tackle the illness at its point of origin rather than its downstream symptoms.
Re-tooling the Curriculum for the Cost-Gap Era
Educational practice must also adapt. Introductory courses still depict price movements by sliding points along fixed supply and demand curves. The curves drift almost weekly in the twenty-first century as geopolitics, climate shocks, and demographic shifts buffet input markets. Students need twin inflation engines—demand-pull and cost-push—engraved on their mental dashboards. Graduate syllabi should push further, introducing input-output matrices and network propagation so learners can watch a 200% gas shock in upstream chemicals ripple through plastics, auto parts, and showroom sticker prices with intricate lags. Once confined to toggling unemployment and interest rates, policy-simulation labs ought now to let users experiment with LNG buffer stocks, wage-indexation clauses, and on-shoring subsidies. The Phillips surface has become a living landscape, kinked by non-linearity, elevated by cost shocks, and twisted by global supply chains.
Landing the Policy Plane Before Gravity Wins
Stagflation terrifies because it appears to force a cruel choice between safeguarding purchasing power and protecting employment. The emerging evidence clarifies why that trap keeps springing shut. Inflation is tethered to costs that conventional demand levers nudge only indirectly. If policymakers keep aiming monetary artillery at household demand while upstream prices remain volatile, they will merely trade away growth with scant improvement in the price index. Recognizing that the Phillips curve has migrated from output to cost gaps is more than a pedantic update; it is the line between a crash landing and a glide path that touches down with inflation and employment intact. Central bankers who train their instruments on upstream costs—while still anchoring expectations—stand a realistic chance of taming prices without strangling recovery. Those who do not will relive the grim lessons of the 1970s with twenty-first-century headlines.
The original article was authored by Luca Gagliardone, a PhD candidate in Economics at New York University, along with three co-authors. The English version of the article, titled "Anatomy of the Phillips curve" was published by CEPR on VoxEU.
References
European Central Bank (2024). The Pass-Through to Inflation of Gas Price Shocks (Working Paper 2968).
Czech National Bank (2024). “The Phillips Curve: A New Era of Non-Linearity?” CNB Blog.
Eurostat (2025). “Euro-Area Labour Cost Index—Q4 2024.”
OECD (2024). “Consumer Prices, October 2024 Statistical Release.”
International Monetary Fund (2025). World Economic Outlook, April 2025.
European Central Bank (2025). Eurosystem Staff Projections, June 2025.