Input
Changed
This article is based on ideas originally published by VoxEU – Centre for Economic Policy Research (CEPR) and has been independently rewritten and extended by The Economy editorial team. While inspired by the original analysis, the content presented here reflects a broader interpretation and additional commentary. The views expressed do not necessarily represent those of VoxEU or CEPR.
If inflation in the early 2020s taught economists anything, the relationship between costs and prices behaves like a taut metal spring: stretch it a little, and it pulls back gently; stretch it far enough, and the resistance suddenly stiffens. That formerly ignored kink destroyed the forecasting power of every linear Phillips curve still lurking in policy models — and it carries profound implications for how central banks should respond the next time a shock arrives.

Unveiling the Significance of the Hidden Bend in the Phillips Curve
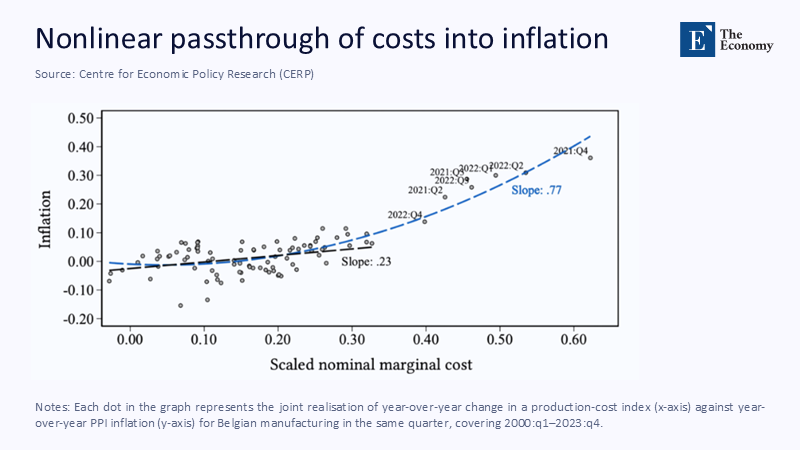
For half a century, the canonical Phillips curve appeared almost comfortingly straight. Small cost shocks passed through to prices in neat, proportional steps, and policy rules were built around that idea of linearity. Yet data collected since the pandemic show that proportionality collapses once cost pressures cross a critical threshold. Using a newly constructed cost index for 3,700 Belgian manufacturing plants, Gagliardone et al. demonstrate that normal-time changes in marginal costs map into producer-price inflation with a slope of roughly 0.23, but once nominal costs spike by more than 30 %, the slope triples to 0.77, producing a "hockey-stick" response that standard models never capture. Evidence from the United States echoes the finding: the San Francisco Fed's nonlinear Phillips curve, which measures slack by the vacancy-to-unemployment ratio, steepens sharply when that ratio falls below unity and flattens just as dramatically in slumps.
The nonlinearity matters because the macroeconomic loss function that guides monetary policy is quadratic in inflation gaps. Put the two convexities together—a curved pass-through and a quadratic welfare function—and a shock twice as large can produce not double but four times the welfare cost. During the energy price shock of 2021-22, Belgian firms incurred a 6.2 % quarter-on-quarter rise in variable costs, which translated into a 9.8 % annualized PPI surge; a linear model would have predicted barely two-thirds of that jump. The "excess" inflation, small on its own, translated into a welfare loss equal to a full two-percentage-point rise in unemployment under a standard calibration.
Pass-Through in the Extreme: What the Micro Data Reveal
Figure 1, reproduced from Gagliardone et al., plots every quarterly observation for Belgian manufacturers between 2000 Q1 and 2023 Q4. The cloud of dots hugs a shallow black trend line until cost shocks cross roughly 0.30 on the horizontal axis; at that point, the dots fan upward, and a red dashed fit climbs at more than triple the previous slope. The visual is striking because it shows that the bend is not a subtle econometric artifact but an eye-level data feature.
Three additional facts emerge once one drills into the micro-level mechanics. First, the probability that any given firm will revise its list price over the following quarter forms a pronounced U-shape against its' price gap,' the distance between the posted price and the frictionless optimum. Small gaps create inertia; significant negative or positive gaps trigger rapid adjustment as firms rush to avoid selling too cheaply or pushing customers away. Second, conditional on changing prices, the average size of an adjustment follows an S-curve: practically linear for modest gaps but steepening markedly in the tails. Third, aggregate shocks such as the 2022 energy spike push the entire distribution of price gaps rightward, dramatically increasing the share of firms stranded in those adjustment-intensive tails. The macro curve thus bends because millions of micro curves switch regimes simultaneously.
A simple simulation drives the point home. Feed the Belgian shock sequence into a menu-cost model in which firms pay a fixed fee to reprint catalogs. When the fee is calibrated to match normal-time behavior, the model reproduces both the size and the timing of the PPI surge — while a Calvo model with constant adjustment probability misses the peak by nearly three percentage points. This difference may sound academic, but three points of surprise inflation on €300 billion of Belgian manufacturing output implies unexpected revenue of almost €9 billion, with equally unexpected wage demands trailing behind. This simulation underscores the practical implications of the research, demonstrating the real-world impact of the hidden bend in the Phillips curve.
How Shocks Rewire the Distribution
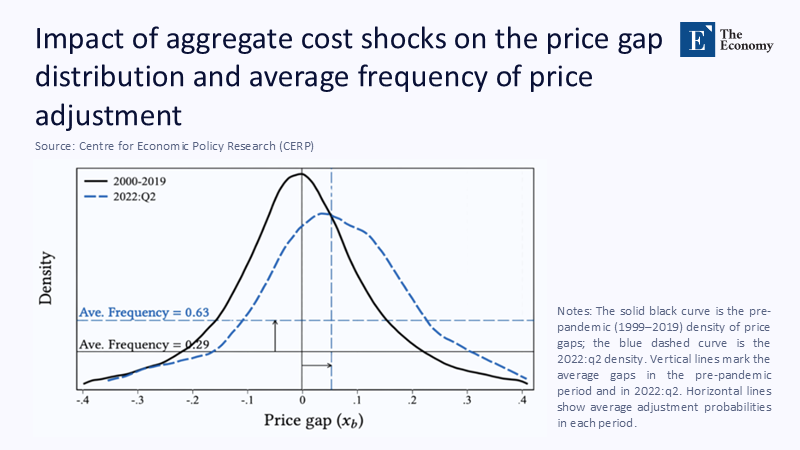
The subtlety of Figure 1 lies in its scatter; Figure 2 shows the same story from a bird's-eye perspective. The solid black curve depicts the pre-pandemic distribution of price gaps—narrow, centered slightly below zero, and associated with a modest adjustment probability of 0.29 per quarter. The red dashed curve represents 2022 Q2: shifted rightward, broadened, and paired with an average adjustment probability of 0.63. Two arrows in the figure indicate the mean gaps before and after the shock, while horizontal lines reveal how many more firms now sit in the "high-urgency" zone. The implication is stark: what looks like a macro-level parameter change—the Phillips curve's slope—is a composition effect driven by thousands of firm-level decisions. The economy's aggregate response changes because the microenvironment has been jolted out of its comfort zone.
That composition effect explains why the inflation descent after mid-2023 was faster than many central banks predicted. Once firms had paid the menu cost and updated prices at break-neck speed, they continued for several quarters even after energy prices retreated. The adjustment machinery, once unjammed, stayed fluid, allowing prices to come down with surprisingly little real-activity pain. The San Francisco Fed's October 2024 blog post documents the same phenomenon for the United States, crediting elevated vacancy-to-unemployment ratios in 2021-22 for a steep part of the Phillips curve that later flattened as vacancies normalized, facilitating what markets now call the "soft landing."
Frequency versus Magnitude: The Menu-Cost Channel
Micro evidence also reveals that most of the nonlinear pass-through stems from frequency, not individual changes in size. In tranquil periods, only about one in ten Belgian plants re-post a price each quarter. That share rose to one in five during the 2022 shock, even though the average price change per adjustment increased by merely a few tenths of a percentage point. Such behavior makes sense in a world with fixed menu costs. Once a shock is big enough to offset the cost of changing, many firms jump at once, producing a macro-level inflation burst that is discontinuous in the size of the shock. Calvo pricing, which forces a constant probability, cannot reproduce that cliff; menu-cost models can.
Yet the menu-cost channel cuts both ways. If policymakers manage to prevent the adjustment frequency from doubling in the first place—say, by signaling earlier rate hikes and dampening expectations—the economy may never hit the nonlinear region. The shock remains a kink in costs, not a price spiral in that universe. The policy art, then, lies in recognizing the threshold ex-ante.
From Micro Kinks to Macro Surges
The latest literature proposes several ways to detect that threshold in real-time. One approach pursued by Crust, Lansing, and Petrosky-Nadeau at the FRBSF is to monitor the vacancy-to-unemployment ratio and use its deviation from historical norms as a trigger. Their 2023 Economic Letter shows that each 0.1 drop in the ratio below unity raises the slope of the Phillips curve by roughly 15 %—a bell that cannot be un-rung once it tolls. A second approach looks directly at high-frequency import-cost data, which flagged the 2021 shipping-rate explosion six months before headline PPI responded. A third leverages scanner data on grocery prices to gauge adjustment frequency weekly rather than quarterly; once that frequency exceeds its 90th-percentile historical value, central banks could deploy what one Fed governor calls a "pre-emptive nudge" of 25-50 basis points.
Those early-warning systems are becoming indispensable. Recent research presented at the Kansas City Fed's Jackson Hole symposium warns that the U.S. labor market may be "one vacancy shock away" from flipping back into the steep region of the curve if job openings continue to retrench. The paper by Benigno and Eggertsson models the Phillips and Beveridge curves jointly and finds that a modest rise in unemployment could quickly snowball unless policymakers offset the drop in vacancies with accommodative moves. The lesson is unsettling: nonlinearity makes overheating and undershooting more dangerous because the economy can skid into either ditch once the steering angle exceeds a narrow, safe range.
Recasting Policy Frameworks
Recognizing the kink is only a first step; institutions must redesign their tools accordingly. Monetary policy has three immediate adjustments to make. First, it must accept that the optimal control solution under a curved Phillips curve is necessarily front-loaded. Waiting for headline inflation to confirm a regime shift is like applying the brakes until one skidded into the guardrail. A Bayesian policy rule that weights menu-cost probability alongside slack closes much of the welfare gap relative to the textbook Taylor rule in simulations calibrated on 2021-24 data.
Second, fiscal stabilizers should trigger unemployment and real-time cost indicators. For instance, the pandemic-era transfer programs in the euro area were rightly generous when factories stood idle. Still, many continued to pay out even after the cost indices appearing on the horizontal axis of Figure 1 had crossed their nonlinear thresholds. Tying benefit tapering to metrics like energy import prices or maritime freight rates would have trimmed disposable income growth before it collided with constrained supply, curbing the pass-through channel at its source.
Third, communication must reflect the kink. During the "transitory" debate of 2021, policymakers emphasized that cost shocks would fade; they seldom mentioned that the curve could bend while the shock lasted. Had central banks published fan charts whose upper tails widened proportionately to vacancy-rate deviations or cost-index spikes, private-sector forecasters might have priced in the tail risk of a steeper slope earlier, nudging wage negotiators toward shorter contracts and reducing backward-looking inertia.
The payoff for such redesigns can be significant. Barron's analysis of Fed communications suggests that the clarification of intent in late 2022—that is, when the Fed shifted from talking about "transitory" forces to expressing readiness to act—coincided with a four-percentage-point drop in five-year inflation swap rates, effectively tightening financial conditions without a single additional hike. Communication becomes a policy instrument when it makes the kink visible.
Curvature as Destiny
The early-2020s inflation surge was not just a bigger wave on the same calm sea; it was evidence that the sea floor had an underwater ridge that standard sonar never picked up. Every major macro model now faces a choice: build the ridge into the map or risk running aground again. The curvature in cost-price dynamics is not an exotic property reserved for crises; it is a latent characteristic of modern, globalized production systems that surface whenever costs move far and fast enough. The past four years prove that such moves are no longer once-in-a-generation events but recurring features of a supply chain world susceptible to pandemics, geopolitical shifts, and climate shocks.
The policy can still deliver stability only if it acknowledges the hidden bend. That means earlier action, broader stabilizers, and more explicit warnings, all calibrated to a curve that grows steeper the further one strays from equilibrium. To ignore that curvature — to treat the inflation engine as linear when it is not — is to demand a precision they cannot deliver from monetary and fiscal levers. Therefore, the task for the next cycle is not a heroic intervention but humble recognition: when the spring is stretched, it fights back hard. It is better to ease the tension before the metal snaps.
The original article was authored by Luca Gagliardone, a PhD candidate in Economics at New York University, along with three co-authors. The English version of the article, titled "Micro and macro cost-price dynamics in normal times and during inflation surges," was published by CEPR on VoxEU.
References
Benigno, P., & Eggertsson, G. (2024). "US Job Market May Be Near Tipping Point." Kansas City Fed Symposium (Reuters summary, 23 Aug).
Crust, E., Lansing, K. J., & Petrosky-Nadeau, N. (2023). "Reducing Inflation along a NonlinearNonlinear Phillips Curve." FRBSF Economic Letter 2023-17, 10 July.
Gagliardone, L., Gertler, M., Lenzu, S., & Tielens, J. (2025). "Micro and Macro Cost-Price Dynamics in Normal Times and During Inflation Surges." VoxEU column, 6 June.
Lansing, K. J., & Petrosky-Nadeau, N. (2024). "Staying on Course: Reducing Inflation along a NonlinearNonlinear Phillips Curve." SF Fed Blog, 21 Feb.
Reuters (2024). "Markets Are Banking on a 'Soft Landing.' Here's How the Fed May Be Pulling It Off." Barron's, 25 Oct.