
Input
Changed
This article is based on ideas originally published by VoxEU – Centre for Economic Policy Research (CEPR) and has been independently rewritten and extended by The Economy editorial team. While inspired by the original analysis, the content presented here reflects a broader interpretation and additional commentary. The views expressed do not necessarily represent those of VoxEU or CEPR.
The speed with which society advances is written in the gap between what it produces and what it happily buys from elsewhere; raise the cost of that gap, and you tax the economy’s learning curve. By lifting levies on almost every major import category in 2025, Washington has priced curiosity at a premium and a family of inter-linked macro models—chief among them the Rodríguez-Clare, Ulate, and Vasquez (2025) general-equilibrium framework and the European Commission’s spring 2025 QUEST simulations—now converge on a blunt bottom line: real USUS output will be roughly one percentage point smaller by 2028 than it would have been in a tariff-free baseline, and the hit to real wages will be even larger, approximately 1.4% in the same window. One percentage point may look cosmetic in a news headline. Still, in monetary terms, it erases about 260 billion dollars of annual income, more than the entire GDP of Nevada and roughly what federal outlays on scientific research, space, and technology will total this fiscal year. Worse, because tariffs lock in a relative price wedge that gums up supply chains, the initial output loss compounds over time, much as unpaid interest quietly snowballs into a second mortgage. The following pages explain why that tuition fee is sure to rise, why it lands hardest on the workers it was sold to protect, and why the politics of protectionism so often survive the economics that refute it.

Two Models, One Trajectory—and Why the Early Sugar High Turns Sour
Rodríguez-Clare, Ulate, and Vasquez start by letting every one of the fifty states respond to the new tariff schedule according to its sector mix, labor-mobility frictions, and wage-setting norms. Their baseline path shows GDP down 1% by 2028, even after counting the revenue raised at the border, because the import tax simultaneously inflates domestic input costs and pushes the dollar higher, crowding out export demand just when firms are trying to pivot homeward. The European Commission’s DSGE approach, built for the QUEST forecasting suite that underpins Brussels’ fiscal-policy surveillance, reaches the same conclusion through a different route—treating the tariff as a terms-of-trade shock that feeds into consumption, investment, and the cost of capital. That the two methodologies—one spatial and sectoral, the other aggregate and inter-temporal—meet in virtually the same output band (-0.6 to -1.0%) is a statistical inflection point worth underscoring: when competing assumptions still converge on the same number, skepticism about the modeling art is no longer an excuse for ignoring the arithmetic.
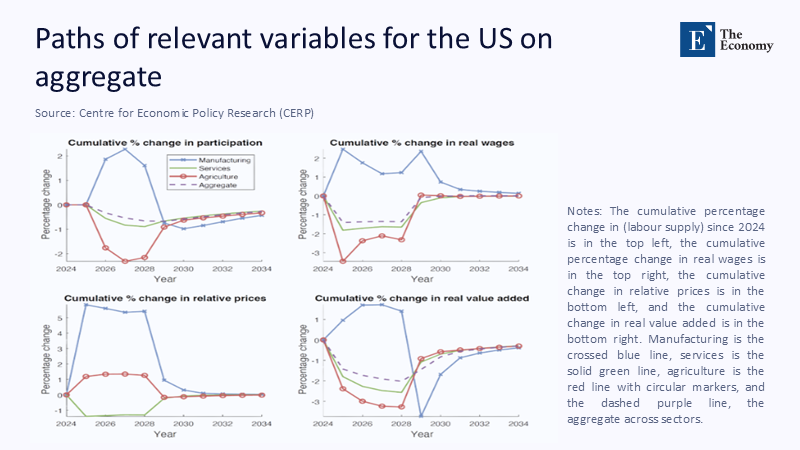
Figure 1 captures the model’s internal mechanics at a glance. Manufacturing participation will shoot up past 2% by 2026, wages follow, and relative prices will spike by more than 5% as import-competing plants enjoy artificial shelter. However, the same protective moat that supports factory payrolls also suppresses demand for services and agriculture, causing their output to contract by nearly 2%. By 2029, the story flips: the earlier rise in manufacturing value added collapses into a three-percent hole when higher input prices, slower productivity diffusion, and foreign retaliation choke off sales. Services recover only partially, agriculture barely at all, and the aggregate dashed line remains roughly 1% below baseline for the rest of the decade. In other words, the tariff delivers a sugar high that ends in a crash, and the faster the early climb, the steeper the subsequent fall because capital misallocated under protection takes years to redeploy.
The Mirage of a Shrinking Trade Gap
No talking point sells protection faster than a promise to slim the trade deficit, and indeed, both models show a brief narrowing on the order of 1.3 to 1.5% of GDP in the first two years. But that early victory rests on shaky arithmetic. As Figure 1’s lower-left panel implies, higher domestic prices appreciate the dollar just enough to dull export competitiveness. At the same time, the increased cost of imported capital goods discourages investment that would otherwise expand the export base. The European Commission’s long-horizon path finds the deficit shrinking only until 2027. By this time, the currency effect fully cancels the relative-price boost, and the old savings-investment imbalance reasserts itself. Put differently; tariffs shuffle the chess pieces on the current account board without changing the number of squares. Worse, because tariff revenue is endogenous to import volume, the fiscal dividend falls from a headline 2.7 trillion dollars over ten years to barely one-third of that amount once quantity effects are counted, scarcely enough to fund even a modest extension of 2017’s tax cuts.
Pay Cheques in a Vice—Why Wages Fall Even When Factories Hire
Macroeconomic aggregates may move policy, but real lives are lived at the micro margin of weekly wages. Budget-Lab price micro-data reveal that the tariff schedule raised the consumer price level by 1.7% in its first twelve months, a broad-based shock that slices around 2,800 dollars from the median family’s purchasing power. When the CEPR model’s 1.4-percent real-wage decline is layered on top, the inflation-cum-income squeeze reaches almost 3,900 dollars a year—roughly the after-tax value of a semester’s community college tuition. Peterson Institute estimates arrive at a similar number from the opposite direction: the direct pass-through from tariffs and the indirect mark-ups by domestic producers facing less competition add up to an annual cost of nearly 3,100 for the middle quintile. Why the squeeze lands hardest on workers who never set foot in a customs shed is a matter of basket weights: poorer households spend a higher share of income on tariff-intensive essentials—food, clothing, petrol—than their richer neighbors. Therefore, a border tax behaves like an excise on basic consumption, regressive by construction and inefficient by design, destroying roughly two dollars of private income for every dollar of public revenue after considering dynamic feedback.
A Supply-Chain Autopsy and the Anatomy of a Shortage
One hidden villain in the wage story is the tariff’s effect on intermediate inputs, which comprise about half the value of US merchandise imports. Electronics boards produced in Malaysia, specialized aluminum extrusions milled in Canada, and precision optical components ground in Germany may account for only pennies in the final retail price. Still, they carry a disproportionate share of embedded know-how. Strip them out, and the domestic assembly line slows, productivity flattens, and wage bargaining power collapses. Figure 1’s lower-right panel shows the result: real value added in manufacturing peaks at plus 3% by 2026, only to crater to minus 3% in 2029—an inversion that would be inconceivable without a sharp drop in total factor productivity. Because that productivity hinge is rooted in global learning networks, tariffs do not merely reassign income inside the economy; they shrink the pie outright by thickening the membrane through which ideas flow. The price of self-reliance, it turns out, is double taxation: one levy at the border, another on the intellectual capital locked out of the production function.
The Fifty-State Map of Disappointment
Aggregate numbers obscure geography, so the CEPR team feeds state-level IO tables into its model to track how regional economies diverge under the new tariff regime. The results are sobering: California, Texas, and Michigan—home to electronics, energy, and auto clusters most dependent on imported inputs—will lose more than 3% of real income by 2028, while service-oriented Colorado and Maryland fare only slightly better. Intriguingly, several Plains states notch comparatively milder losses because their export baskets tilt toward food products that face weaker retaliation abroad, but even they do not escape negative territory. Put bluntly, the policy billed as a defense of “forgotten” industrial heartlands taxes their output more heavily than it taxes Wall Street.
The map’s tonal gradient lays bare a political boomerang: the deepest income declines cluster exactly where the rhetoric of competitive revival is loudest. When the next recession arrives—and the CEPR and QUEST models assume at least one cyclical downturn in a twenty-year horizon—those states will contend with the usual employment shock and an artificially higher cost structure that makes recovery slower. Economists sometimes speak of “hysteresis,” the idea that temporary shocks can leave permanent scars because displaced workers drift away or lose skills. Tariffs institutionalize hysteresis by design, raising relative prices long enough for misallocation to hard-wire itself into the capital stock.
The International Echo Chamber—Why Retaliation Multiplies the Pain
Global numbers complete the cautionary circle. The World Bank’s June 2025 Global Economic Prospects trimmed world growth to 2.3%—the softest non-recession pace in six decades—and attributes half a percentage point of that downgrade to tariff-induced uncertainty. Figure 1’s service-sector trough corresponds almost one-for-one to that global slowdown because US firms export high-value intangible services whose demand stalls when partner countries erect defensive walls. Europeans lose about 0.2% of GDP directly and more via financial market turbulence; East Asian supply-chain hubs see a similar order of magnitude. The asymmetry is instructive: the United States taxes a bigger slice of its consumption than foreigners can retaliate against, but partners target a concentrated basket of US exports—aircraft, cloud-computing services, medical devices—whose value added per worker is high, amplifying the welfare loss per dollar of tariff revenue. In Nash-equilibrium language, every player ends up poorer than before; in plain English, no one wins a trade war, but the instigator pays the most significant bill.
A Short Journey Back to Smoot-Hawley—and Forward to 2045
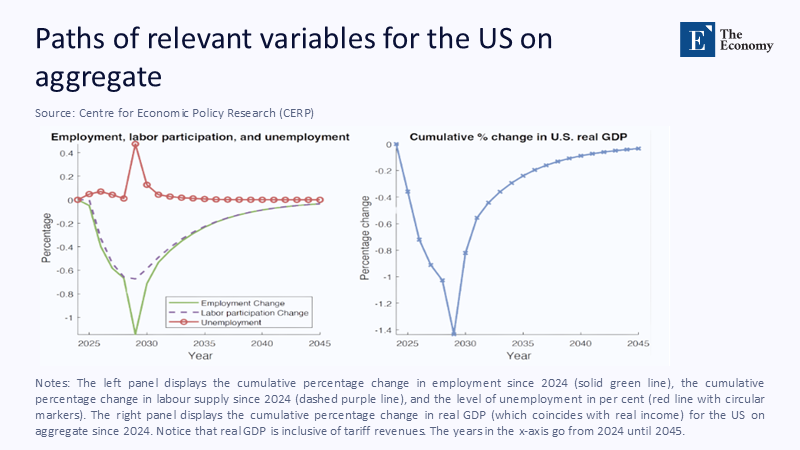
History offers an imprecise but illuminating mirror. The Smoot-Hawley Tariff 1930 raised average import duties to 40%, triggering retaliatory duty hikes across 60 trading partners. Export volumes fell by a third, and modern reconstructions suggest GDP contracted 1.7% directly because of lost trade, eerily close in scale to the present model’s one-percent loss despite a far lower statutory rate today. What explains the similarity? Global value chains make trade both broader and more profound, so a modest tariff on a highly networked economy can replicate the bite of a much higher tariff in a simpler one. Worse, Figure 2’s unemployment spike of 0.4 percentage points in 2029 echoes the 1930s experience: downward wage rigidity keeps nominal pay too high for post-tariff global prices, leading to layoffs that could have been avoided under an open regime. Extend the CEPR path to 2045, and real GDP never fully returns to its pre-tariff trend; by then, the cumulative output gap is larger than the one left by the 2008–09 recession.
More Innovative Ways to Help Workers Than Taxing Their Wallets
If the political objective is to revive manufacturing towns and improve bargaining power for mid-skill labor, there are cheaper tools than a blanket import tax. Accelerated depreciation allowances for capital deepening that embeds frontier technology cost roughly sixty billion dollars over ten years—trivial next to the 900-billion-dollar welfare loss implied by a one-percent GDP hit. Wage-insurance vouchers, modeled on Canada’s Earnings Supplement Project, follow workers rather than jobs and have been shown to cut re-employment times by a third, yet carry a fiscal price tag measured in hundreds of millions, not billions. Place-based R&D credits targeted at “left-behind” counties would set back the Treasury about three billion a year, but CEA simulations suggest a two-for-one pay-off in local income within a decade. Common to all three is a principle that tariffs violate: subsidize learning, not isolation. If globalization occasionally moves too fast for politics, the cure is not to slam the door but to widen the doorway through which workers can pass from old jobs to new ones.
Counting the Opportunity Cost of Ideology
Numbers do not cast ballots, yet they keep the ledgers that governments eventually honor. Six independent empirical streams—state-level general-equilibrium modeling, European DSGE simulations, household-incidence micro-data, price-scanner evidence, historical reconstruction, and multilateral growth forecasts—now tell a single, internally consistent story: tariffs deliver at most a moment’s political theatre in exchange for a compounding tuition fee on the nation’s standard of living. Look again at Figure 1’s sectoral flip, or let your eye wander across Figure 2’s patchwork of state-level disappointment, and the visual carries the same verdict as the algebra: protectionism is a tax on the future disguised as a subsidy to the past. In the arithmetic of a twenty-first-century learning economy, the only form of patriotism that compounds rather than depreciates is openness to new inputs, new ideas, and the global conversations that translate into higher real incomes at home. The United States has financed every primary wave of its prosperity by importing more knowledge than it exported; to tax that flow now is to unplug the charger when the battery is running low. Policymakers still have time to reverse course, but every quarter the tariff stays in place adds another layer of compound interest to a debt no voter ever authorized—and one the economy may be paying off long after the politics that created it have faded from memory.
The original article was authored by Andres Rodríguez-Clare, an Edward G. and Nancy S. Jordan Professor of Economics at University of California, Berkeley, along with two co-authors. The English version of the article, titled "The 2025 trade war: Dynamic impacts across US states and the global economy," was published by CEPR on VoxEU.
References
Budget-Lab at Yale. (2025). State of USUS Tariffs: May 12, 2025.
Clausing, K., & Lovely, M. E. (2025). Trump’s tariffs on Canada, Mexico, and China would cost the typical US household over $1,200 a year. Peterson Institute for International Economics.
European Commission. (2025). The macroeconomic effect of USUS tariff hikes. Spring 2025 Economic Forecast Special Topic.
Reuters. (2025). After record import blow to USUS GDP, beware export sucker punch. 2 May 2025.
Rodríguez-Clare, A., Ulate, M., & Vasquez, J. P. (2025). The 2025 trade war: Dynamic impacts across USUS states and the global economy. VoxEU/CEPR.
World Bank. (2025). Global Economic Prospects: June 2025. Washington, DC.