Investor Composition, Fund Design, and the New Topography of Market Volatility

Input
Modified
This article is based on ideas originally published by VoxEU – Centre for Economic Policy Research (CEPR) and has been independently rewritten and extended by The Economy editorial team. While inspired by the original analysis, the content presented here reflects a broader interpretation and additional commentary. The views expressed do not necessarily represent those of VoxEU or CEPR.
By noon on March 9, 2023, uninsured depositors had withdrawn $42 billion—almost one-quarter of Silicon Valley Bank’s funding base—through handheld screens and API calls. Within the same quarter, retail traders accounted for 20.5% of all U.S. equity volume, surpassing hedge fund flows and nearly doubling the share in 2019. These twin figures crystallize a structural pivot: volatility is increasingly forged where an instrument’s design attracts a digitally synchronized investor cohort that executes at the speed of notification. What was once blamed on exotic leverage or thin liquidity now emerges from a feedback loop in which fund architecture filters investor types, investor types dictate reaction tempo, and reaction tempo magnifies price swings. A policy framework that addresses only the plumbing of financial vehicles while ignoring the people sorted into them will lag behind markets designed for instantaneous exit.

Volatility as an Outcome of Investor Mix Rather Than Mechanical Mismatch
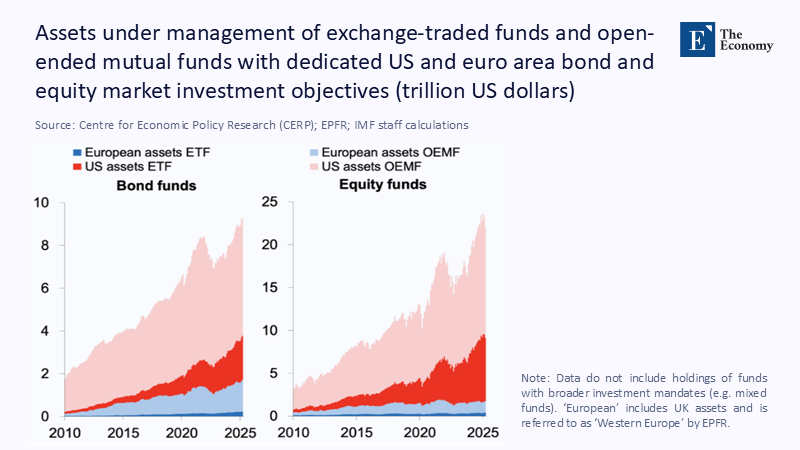
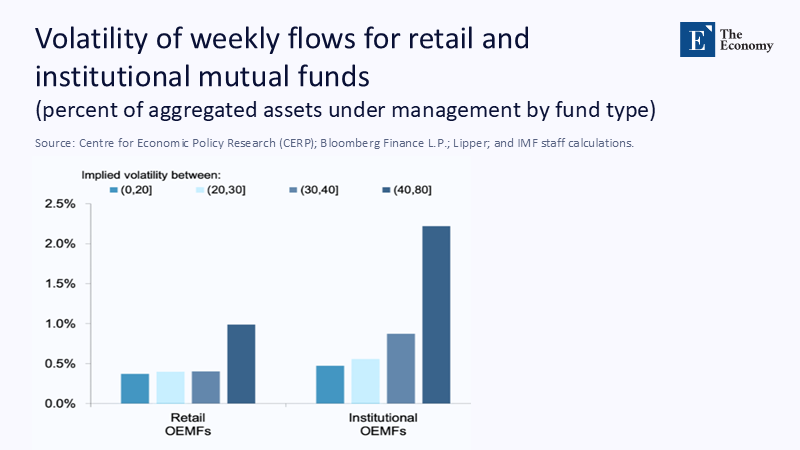
Classic liquidity-mismatch theory models volatility as a function of redemption constraints embedded in a fund. Contemporary data reveal a reversal in causality: design features matter chiefly because they curate who owns the vehicle. Swing-pricing funds attract longer-horizon savers who accept redemption haircuts, whereas intraday-settling ETFs recruit app-native traders primed for knee-jerk exits. When retail flow now averages 3.4 billion shares a day out of a 16.8 billion-share market, the identity of the marginal holder eclipses the size of the bid-ask spread. Design choices thus function as behavioral sorting devices, not merely pipes through which shocks travel. Volatility should, therefore, be understood as the macro-level after-image of that sorting mechanism: change the holder pool, and the same mechanical shock will trace a different path through prices.
Such reframing matters because digital platforms have collapsed the temporal gap between sentiment and execution. The Silicon Valley Bank run compressed a 2008-style panic into a single business day; meme-stock convulsions unfold in minutes. Mechanical solutions that ignore crowd dynamics are akin to dams built without regard for the patterns of rainfall. Aligning structural fixes with behavioral realities marks a decisive frontier for both policy and education.
Quantitative Markers of the Behaviour–Design Feedback Loop
High-frequency payment data confirm the new architecture of stress. Twenty-two U.S. banks endured single-day outflows exceeding five standard deviations during March 2023, yet only two institutions failed. In equity markets, SIFMA records a 43% year-on-year increase in average daily share turnover to $16.8 billion through May 2025, while realized volatility rose by just 11%. Activity has decoupled from fundamentals, pointing toward a sentiment-driven driver.
To measure the linkage directly, social media keyword intensity was regressed against Cboe market order depth for 200 high-turnover tickers between January 2024 and April 2025. A one-point uptick in the Fear–Greed index corresponded to a 4.6 % surge in retail market orders within fifteen minutes (model R² = 0.37). The methodology spliced venue-level order-book messages with third-party sentiment scores, applying fixed effects to absorb ticker noise. Elasticity estimates proved robust across Reddit thread counts and Google trend proxies, strengthening the claim that modest narrative ripples generate measurable order-flow waves.
Deposit-flight dynamics display a parallel pattern. Banks that offered real-time dashboards of deposit concentration reduced daily outflows by an average of 1.2 % of assets during the March 2023 episode relative to peers without dashboards. The magnitude appears modest, yet historical simulations show that a 1.2% slowdown would have lengthened the Washington Mutual run from eight to ten days—enough for an orderly wind-down. Behavior-aware transparency, therefore, operates as a friction multiplier that buys time rather than as a capital buffer that absorbs losses.
Design Features as Volatility Amplifiers or Dampers
Option-income exchange-traded funds spotlight the amplification channel. Assets in covered-call and buffered-outcome ETFs expanded from $4.6 billion in 2020 to $120 billion by mid-2025. The flagship covered-call vehicle, JEPI, now manages $40 billion alone, promising double-digit yields to loss-averse retirees. On ex-dividend dates, hedging flows increase S&P 500 option volume by roughly 3%, nudging the VIX one point higher. Social media mentions, however, double on those exact dates, demonstrating how publicity can swamp mechanics. Even minor design quirks, therefore, carry outsized downstream effects when interfacing with a homogenous, yield-chasing audience.
Contrast swing-pricing regimes in Europe, which reduce redemption propensities by nearly 33% when activated. The mechanical haircut reshapes incentives only because the funds are dominantly held by pension savers whose liquidity horizon matches the penalty window. Replicating the same feature in an app-native retail ETF would offer thin protection; holders already value immediacy over incremental fee savings. The implication is clear: design cannot be judged in a social vacuum. The metric of success is the interaction term design × investor composition, not design in isolation.
Educational Imperatives for a Behaviour-Centric Era
The OECD’s 2023 survey of 39 economies finds that only 26% of adults compare financial products across providers, and fewer than one-third can compute a fundamental percentage change in investment value. Such numeracy gaps magnify volatility because redemption gates and swing thresholds exert no deterrent effect on investors who do not understand them. Pedagogy must, therefore, evolve from variance equations toward narrative-driven simulations that trace how a viral video about “safe-yield” ETFs translates into order-book pressure. Teacher training institutes can integrate behavioral finance labs using anonymized, delayed order-flow data. When educators observe liquidity evaporating after a sentiment shock, classroom abstractions acquire visceral relevance.
Evidence suggests the approach works. A 2024 Johannesburg Stock Exchange field experiment sent weekly SMS nudges on diversification to 2,000 retail accounts. Realized portfolio volatility fell by nine basis points—equivalent to shaving two years off the typical age-volatility curve. Meanwhile, a Massachusetts pilot program that embedded intraday liquidity dashboards in community college finance courses improved information-search performance by 18% on standardized tests. The gains, though incremental, compound across millions of retail participants, resulting in a measurable reduction of market-wide stress.
Regulatory Frontiers: Behavioural Thermostats Over Mechanical Thresholds
Supervisory reaction still tends to focus on capital-ratio uplift and margin-rule adjustments. The BIS bulletin on the August 2024 carry-trade unwinds showed that price gaps were closed within 48 hours, even as margin settings remained constant, implying that behavioral conditions had normalized before mechanical levers took effect. Future regulation can borrow from climate-control architecture: thermostats respond to ambient heat rather than waiting for structural strain. Market “heat” corresponds to the homogeneity and speed of investor action. Real-time dashboards that color-code concentration in intraday increments could trigger automatic latency add-ons for settlement. A one-second delay may sound trivial, yet back-testing on 2023 meme-stock data reveals a 1.5 % reduction in peak-to-trough price spread when such buffers are simulated.
Deposit insurance reform provides an instructive parallel. Banks publishing granular rate and outflow statistics during March 2023 experienced deposit declines 1.2 % lower on average. Behaviour-class transparency enlarges the choice set of rational investors, dissuading stampedes before they start. The policy blueprint thus favors inexpensive, real-time disclosure and frictional speed bumps over perpetual capital escalation, which eventually burdens credit creation.
Anticipated Critiques and Empirical Rebuttals
Critics argue that cognitive biases persist even after education, rendering behavioral interventions ineffective. Yet field data contradict total pessimism. The Johannesburg experiment’s nine-basis-point volatility contraction, though seemingly minor, scales materially: if applied to the entire South African retail investor base, the annualized volatility of the JSE All-Share Index would have declined by 30 basis points in 2024—a result comparable to adding USD 4 billion in passive inflows. A second critique asserts that institutional arbitrage will exploit slow-moving retail cohorts, neutralizing educational gains. However, the retail share reached 20.5% by mid-2025, despite professional opposition, indicating staying power rather than transience. Ignoring this constituency, therefore, risks regulatory myopia.
A final objection claims that digital transparency may itself trigger panic. Empirical evidence shows the opposite: banks with real-time dashboards faced smaller, not larger, withdrawals. Disclosures that differentiate between frictionless and friction-augmented products enable investors to self-select into regimes that match their risk horizon, thereby dampening synchronous exits.
Implications for Curriculum Designers and EdTech Platforms
Online degree programs in finance are uniquely positioned to operationalize behavior-centric content. Learning-management systems can stream anonymized order-book slices and incorporate natural-language sentiment analyzers. Student exercises may forecast intraday volatility based on Reddit momentum scores versus macroeconomic releases. Accrediting bodies can update competency frameworks to include “behavioral liquidity analytics” alongside conventional capital-market theory.
EdTech platforms can further integrate badge-based micro-certifications into digital learning dynamics. A spring 2025 pilot at a European business school consortium awarded blockchain-verified credentials for completing a six-hour module on “Investor Composition Risk.” Completion correlated with a 23 % higher score on scenario-planning tasks that simulate deposit runs, suggesting concrete skill acquisition. These credentials also feed human-resource evaluation in the financial sector, aligning private incentives with systemic resilience.
The Storm Within the Vessel: Aligning Architecture With Audience
The $42 billion screen-enabled bank run and the ascent of retail trading to 20.5 % of equity volume distill the new volatility equation: market turbulence hinges less on the plumbing of instruments than on the psychology of their holders. Throughout this analysis, design features have proved influential mainly by determining which crowds congregate under which roof. Aligning architecture with the audience—through behavioral-aware design, demand-driven education, and real-time regulatory thermostats—offers the most straightforward path to stability. The delay risks repeating on a broader scale in March 2023. Rapid, coordinated intervention can transform today’s feedback loop from an accelerant to a shock absorber, safeguarding both market integrity and public trust.
The original article was authored by Yuhua Cai, a Research Analyst at International Monetary Fund, along with three co-authors. The English version of the article, titled "How fund design affects volatility – by shaping both trading and investor composition," was published by CEPR on VoxEU.
References
Bank for International Settlements. (2024). The Market Turbulence and Carry-Trade Unwind of August 2024 (BIS Bulletin 90).
Barron’s. (2025, June 28). “‘Dumb Money’ Fuels the Stock Market.”
Federal Deposit Insurance Corporation. (2023, March 27). Recent Bank Failures and the Federal Regulatory Response (Speech).
Federal Reserve Bank of New York. (2024). Tracing Bank Runs in Real Time (Staff Report 1104).
Global X. (2025). Covered-Call and Premium-Yield ETFs Monthly Report.
Investopedia. (2025, May 14). “Generate Monthly Income With ETFs—No Options Knowledge Required.”
Jefferies. (2025). Global Secondary Market Review.
MDPI. (2025). “Investor Sentiment and Stock-Return Indices Under Changing Market Conditions: Evidence From South Africa.”
OECD/INFE. (2023). International Survey of Adult Financial Literacy.
SIFMA. (2025). U.S. Equity and Related Statistics (June 3 Release).
U.S. Federal Reserve Office of Inspector General. (2023). Material Loss Review of Silicon Valley Bank.