Fiscal Policy, AI and Monetary News Fail to Explain the Rise in the Natural Rate of Interest
Published
The Economy Research Editorial*
*The Economy Research, 71 Lower Baggot Street, Dublin 2, Co. Dublin, D02 P593, Ireland

The rise in the U.S. natural real interest rate by about one percentage point since 2020 has reignited a debate that had seemed closed for decades, given the rate's steady decline since the 1980s. Three explanations have dominated the public debate: the expectation of a significant widening of fiscal deficits, a potential productivity boost from artificial intelligence and monetary policy's own influence on long-term rates. A high-frequency event analysis across four independent financial models systematically tests whether each of these explanations can carry the weight of interpretation. Fiscal events turn out to explain only one-fifth of the total rise, an effect that is not statistically significant. AI events are systematically associated with a decline in the interest rate. And the meetings of the Federal Open Market Committee, which historically concentrated almost all of investors' long-term readjustment, have completely stopped playing that role after 2020. The result leaves the recent rise in the natural interest rate without a convincing explanation, opening the issue to global forces beyond domestic ones.
1. Introduction - The Puzzle Behind the Rise in the Natural Rate of Interest
For decades, the United States' natural real rate, known in the literature as r*, has been on a downward trend. This is the short-term real interest rate that would prevail in the absence of transient shocks, a figure that is not immediately observed but is inferred from market data, macroeconomic models and opinion surveys.[1, 2, 3] In the 1980s and 1990s its decline mainly reflected a decline in inflation expectations as the Federal Reserve's credibility gradually consolidated. In the 2000s and 2010s, however, the continuation of the decline was due to deeper structural factors: lower productivity, an ageing population, cheaper capital goods and strong precautionary savings from emerging economies, factors that have been extensively documented in the relevant literature.[4]
Since 2020, however, this long trend seems to have reversed. Almost all available estimates of r* record an increase of about one percentage point from the lows of 2020 to the end of 2025.[5] The Blue Chip survey among professional economists, which subtracts the projected inflationary change from the projected path of the key interest rate five years ahead, shows a long decline of more than two percentage points before the pandemic and then a reversal of about one point.[6] A similar picture is given by the long-term projections of the members of the Federal Open Market Committee, as recorded in their regular economic projections.[7] Macroeconomic models, such as the one developed by Del Negro and colleagues, deriving the permanent component of the real interest rate from nominal bond yields, inflation and long-term expectations data, show a less pronounced but similar trajectory.[8] Finally, four different term structure models, which derive estimates of r* from the prices of US Treasury bonds hedged against inflation daily, also converge on a rise of about one percentage point from their lows in 2020 or 2021.[9, 10, 11]
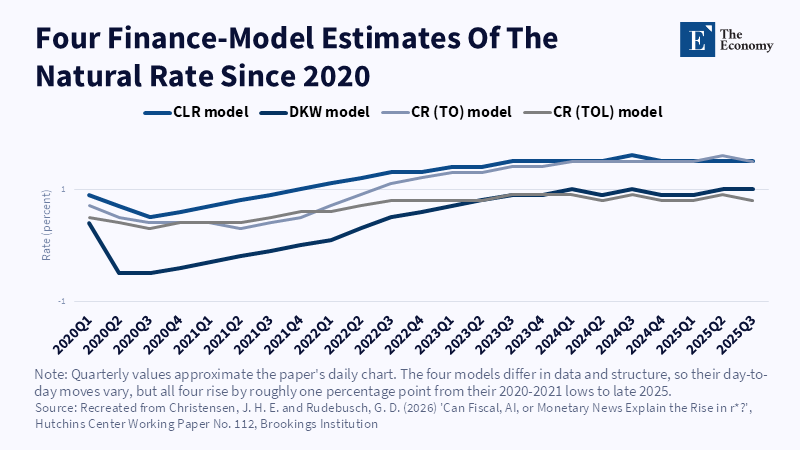
The trajectory of the four financial estimates, taken separately for the period after 2020, sharpens this picture. Although they differ in level, with a deviation of about one percentage point from each other at any given time and although they show noticeable differences in their short-term fluctuations, they agree on the direction: all four record an increase of about one percentage point from their lows in 2020 or 2021 by the end of 2025.[12] This convergence, despite methodological differences, is one of the reasons why the authors consider their use as dependent variables in the following analysis of events to be reliable.
2. Why The Natural Rate of Interest Matters
The r* matters well beyond economic theory. For fiscal officials, it is a critical indicator of debt sustainability. For the central bank, it is the benchmark that separates an expansionary from a restrictive monetary policy. For investors, it acts as an anchor for the future discount rate.[13] A permanent rise in r* by one percentage point means permanently higher costs of servicing public debt, a higher neutral benchmark rate for monetary policy and a change in how markets price any future cash flow. This explains why the issue has been of such intense concern to both academic economists and the members of the Federal Reserve themselves.
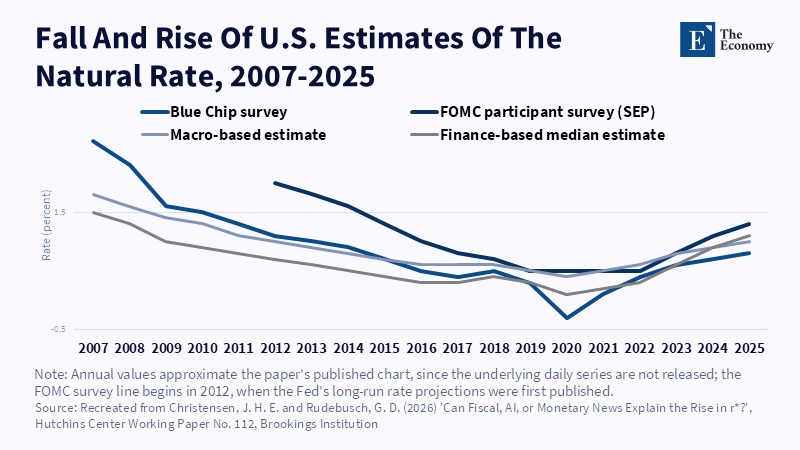
The new paper by Jens H. E. Christensen, from the Federal Reserve Bank of San Francisco and Glenn D. Rudebusch, from the Brookings Institution and CEPR, published in August 2026 as Working Paper 112 of the Hutchins Center on Fiscal and Monetary Policy, does not propose a new explanation for this rise. Instead, it systematically examines the three explanations that have dominated the public debate- fiscal deterioration, artificial intelligence and monetary policy and tests whether each of them can actually support the weight of the explanation.[14]
In addition to opinion surveys and term structure models, there is a third family of estimates, based on pure macroeconomic models. Del Negro and colleagues, for example, use a flexible vector autoregressive model with common trends to extract the permanent component of the real interest rate from nominal bond yields, inflation and long-term survey expectations data.[15] Their estimation generally follows the same downward and rising path as the others, albeit with less pronounced fluctuations. However, as Christensen and Rudebusch note, these macroeconomic models are subject to significant uncertainty as to their specification, in particular as regards production and inflation dynamics, any omitted variables and structural changes within the sample, which makes them particularly difficult to use in the very period under consideration in the study, given the unusual sequence of supply shocks after 2020.[16] Financial estimates based on market data, on the other hand, have the advantage of being able to be produced on a daily basis and reflect information available at the given time, without relying on production and inflation data that are often revised afterwards, making them more suitable for the subsequent event analysis.
3. The Methodology: Analysis of High-Frequency Events
The conventional approach to estimating r* through macroeconomic models faces a serious obstacle in this case: the sample from 2020 to date is too small to confidently separate the trend from the cycle, especially given the unusual sequence of supply shocks in prices and trade during this period. For this reason, the authors have chosen an alternative path: a high-frequency event analysis, similar to those commonly used in empirical monetary policy research, which draws on everyday financial data that constantly incorporates investor expectations.[17]
The method is based on four components. First, a timeline of fiscal news. Second, a timeline of AI innovation events. Third, daily estimates of r* from term structure models. And fourth, a cumulative effect method that follows the approach of Sebastian Hillenbrand, who had shown in an earlier study that tracking changes in yields only within three-day windows around Federal Open Market Committee meetings can capture almost the entire long-term decline in pre-pandemic long-term interest rates.[18] The authors applied the same logic of cumulative change over three-day windows, this time around fiscal, technological and monetary events, to see if they could explain the upward turn in r* since 2020.
For the estimates of r* on a daily basis, four different arbitrage-free term structure models were used: Christensen, Lopez and Rudebusch's CLR,[19] D'Amico, Kim and Wei's DKW[20] and Christensen and Rudebusch's own CR models, one without and one with an adjustment for securities liquidity.[21] The use of all four in parallel serves as a credibility test, as they differ significantly in their structure and assumptions, in particular in the treatment of inflationary expectations and liquidity premiums.
The differences between the four models are not just technical details. The CLR and DKW jointly model nominal and real bond yields, which allows them to separate inflation expectations from risk premia, but also exposes them to a greater risk of misspecification in times of structural change, such as the pandemic period with unusual inflationary shocks. DKW also differs from the CLR in that it incorporates monthly data from professional surveys of inflation forecasters and short-term interest rates and takes into account both term and liquidity premiums. The two CR models, in contrast, are assessed solely from the prices of inflation-hedged bonds, without requiring assumptions for nominal yields or inflation, an option that limits the risk of misspecification but is based on a narrower database. The TOL version differs from the simple TO by adding a time-varying adjustment for the liquidity of TIPS securities, which can differ significantly from the liquidity of conventional government bonds, especially in times of crisis.
4. The Fiscal Case: Deficits, Debt Projections and a Modest Rate Response
The first and most widespread explanation links the rise of r* to expectations of a significant widening of fiscal deficits. Former Federal Reserve Governor Christopher Waller had warned in 2024 that the country was on an unsustainable fiscal path and that large deficits would exert upward pressure on the natural interest rate.[22] Stephen Miran expressed the opposite view, arguing that recent fiscal decisions, such as the imposition of tariffs, were actually putting downward pressure on the natural rate.[23]
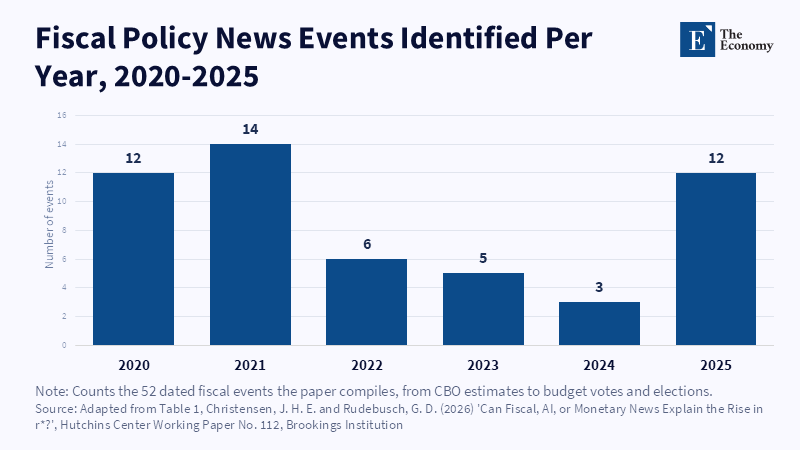
To empirically examine the issue, the authors recorded 52 fiscal events from January 2020 to September 2025. The timeline includes official cost estimates of the Congressional Budget Office, milestones in the parliamentary budget and reconciliation process, as well as major political events that conveyed new information to investors, such as the Democratic victory in the Georgia election in January 2021, the Manchin-Schumer public agreement on the Inflation Reduction Act in July 2022, the debt ceiling agreement between Biden and McCarthy in 2023 and the passage of the One Big Beautiful Bill Act in the summer of 2025.[24] The choice of events was deliberately broad so as not to omit any significant fiscal developments, meaning that the final estimate of the fiscal impact is likely at the upper, not conservative, end of the actual outcome.
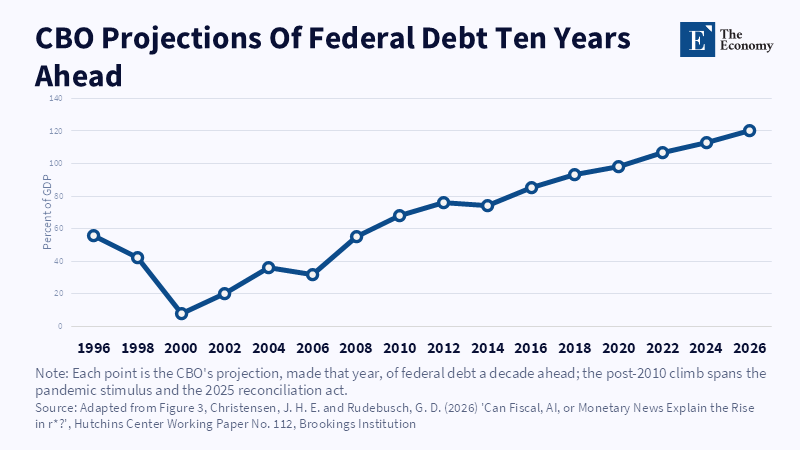
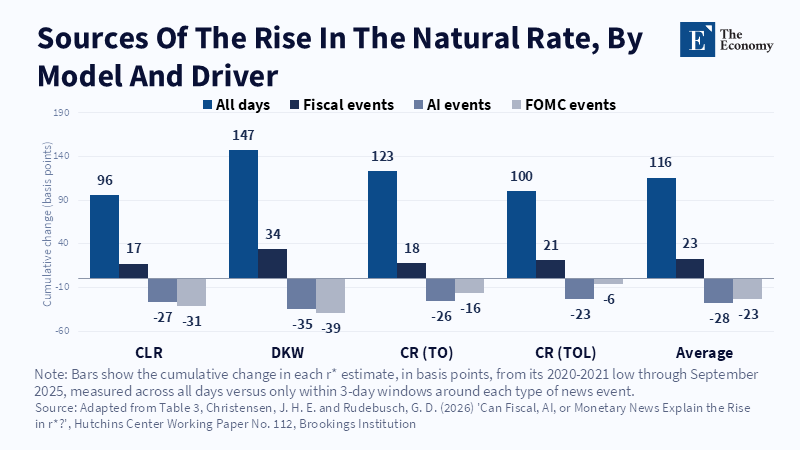
As a result, fiscal events contributed an average of only 23 basis points to the total increase of 116 basis points recorded in the four estimates from their lows to the end of the sample, or about one-fifth of the overall rise. This effect was not statistically significant in any of the four estimates, although the average daily changes within the three-day fiscal windows were consistently positive. A similar picture emerged for nominal and real yields on longer-dated bonds. Even projected debt as a percentage of GDP, which increased by about 20 percentage points over the same period according to the Congressional Budget Office's long-term projections, appears to have left a limited footprint on the natural interest rate, although it affected the nominal yields of ten-year bonds more noticeably.[25] To identify fiscal events, the authors combined two different traditions of the literature. The first focuses on formal budget announcements, such as the Congressional Budget Office's cost estimates, an approach recently taken by Gomez-Cram, Kung and Lustig and Wiegand, who constructed a series of fiscal shocks from the milestones of the parliamentary budget and reconciliation process.[26, 27] The second, more narrative in nature, encompasses a broader set of political news, such as announcements of agreements, unexpected plenary votes and election results, a logic followed by earlier fiscal policy analyses such as that of Romer and Romer.[28] The choice to combine both traditions, rather than using only one, explains why the final total reached 52 events, a number greater than would have been obtained if the criterion had been strictly limited to official institutional announcements.
This finding matches previous literature, such as the estimates of Gust and Skaperdas, who found that a permanent increase in the deficit-to-GDP ratio of one percentage point raises long-term real yields by just one to six basis points.[29] More specifically, by measuring the cumulative change from the lowest point of each estimate to the end of the sample, the CLR estimate rose by a total of 96 basis points, of which only 17 occurred within fiscal windows. The DKW estimate rose by 147 basis points in total, with 34 points within fiscal windows. The two versions of the CR model showed an overall increase of 123 and 100 basis points, respectively, with 18 and 21 points attributed to fiscal events. On average, fiscal events explain about one-fifth of the overall rise, a percentage that the authors themselves describe as modest given the broad definition of events they adopted. For nominal yields on ten-year bonds, the overall change within the fiscal windows amounted to about 65 basis points, which, when compared with the increase of about 20 percentage points in the debt-to-GDP ratio over the same period, implies a standardized response of about 3 basis points per percentage point of deficit expansion, a figure consistent with the previous literature. The corresponding response for r* itself was much more limited, just 0.3 to 1.5 basis points per standard fiscal shock.[30]
5. The Artificial Intelligence Case: Model Releases and a Falling, not Rising, Rate
The second explanation, theoretically developed by Lukasz Rachel and publicly adopted by Fed Governor Michael Barr, is based on the idea that a sustainable increase in productivity due to artificial intelligence would increase the demand for capital and reduce households' saving incentives, thus pushing the r* higher.[31, 32] An opposing view, expressed by Stephen Miran and Fed Chairman Kevin Warsh, argues that AI acts as a strong disinflationary and allows for looser monetary policy without the risk of overheating, which would mean a lower, not higher, long-term benchmark rate.[33]
To empirically test these conflicting positions, the authors cataloged the release dates of the major generative AI models from four labs, OpenAI, Google, Anthropic and xAI, starting with the launch of ChatGPT on November 30, 2022.[34] The choice of this starting point is not accidental and the authors explain in detail why they discarded older milestones as starting points of their timeline. Earlier milestones, such as Google's announcement of LaMDA in 2021 or the publication of the research paper on PaLM in 2022, remained largely within the research community and did not attract widespread coverage from the financial press. ChatGPT, on the contrary, immediately became freely available to the public, reached one million users within five days and marked the moment when investors essentially began to assess the economic consequences of generative AI.
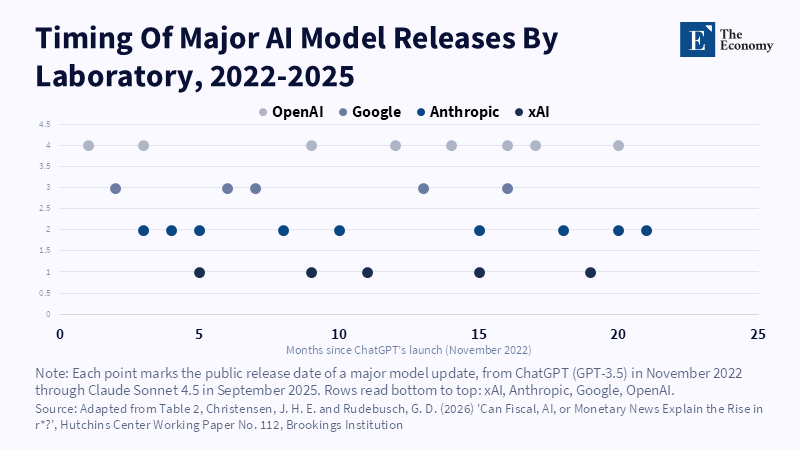
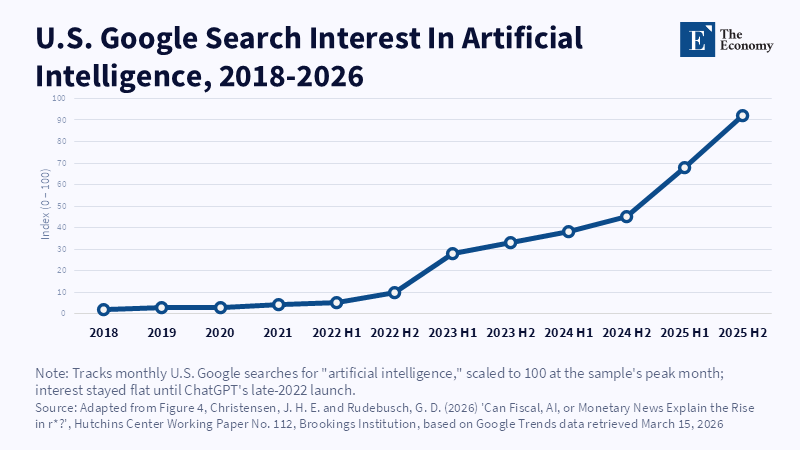
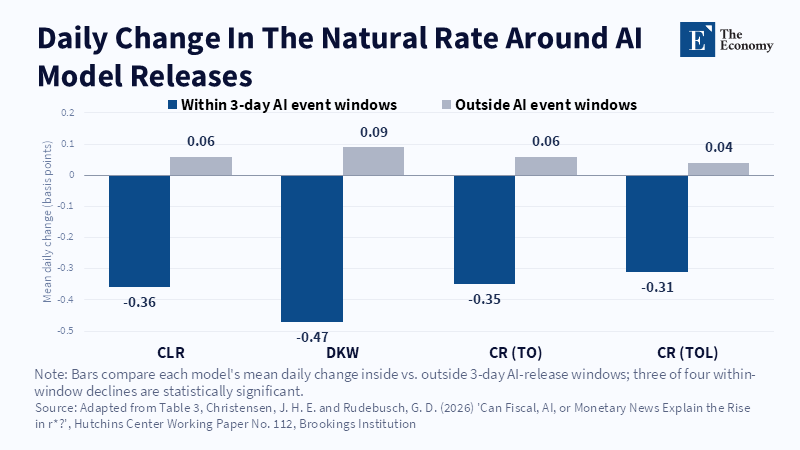
The result was in stark contrast to the bullish pressure hypothesis. Around these events, the four estimates of r* recorded a cumulative decline of 23 to 35 basis points, with statistically significant negative signs in three of the four cases.[35] The dips were relatively evenly distributed over time and did not cluster around one or two individual dates. These findings agree with earlier research by Isaiah Andrews and Maryam Farboodi, who had also recorded a decline in long-term bond yields around large AI model releases, albeit with much wider observational time windows. The timeline of technological events recorded by the authors includes 25 model releases from November 2022 to September 2025, from OpenAI's GPT-3.5 and Google's Bard to Anthropic's Claude Opus 4.1, OpenAI's GPT-5 and xAI's Grok 4. Over the same period, a Google search volume index for the term artificial intelligence in the United States remained nearly flat until late 2022 and then rose sharply, reaching almost the top end of the scale by 2025 and 2026, a picture that confirms that the interest of the general public and by extension, likely investors, in AI was almost non-existent before the release of ChatGPT and skyrocketed afterward.[36]
The exact cause of this decline remains an open question for the authors. They cite as possible explanations both the disinflation described by Warsh and Rachel's hypothesis that uncertainty around a technological change of such a scale could increase precautionary savings and thus lower the natural interest rate, as well as a third possibility considered by Andrews and Farboodi, that news about artificial intelligence may increase expectations of future tax revenues and thus reduce the credit risk premium of U.S. government debt.[37] None of these assumptions are fully confirmed by the broader data available, such as savings rates or inflationary expectations surveys.
A parallel discussion, under way in the field of organizational management, is worth placing next to this finding, not by the authors of the study themselves, who do not refer to it at all, but as a useful comparison. A current of analysis on the labor market argues that businesses are on the threshold of a radical restructuring around artificial intelligence, organized around three axes. The first concerns the emergence of a new managerial role, beyond the traditional team leader, who no longer guides people but coordinates mixed systems of humans, digital agents and in some disciplines, physical robots, taking on tasks such as the division of tasks, the selection of models, the setting of limits of human intervention and the detection of errors. The second axis concerns measurement: rather than settling for how often AI is used, this analysis proposes to examine whether its use generates enough value to justify its cost in tokens, computing power and human control, a resource-discipline logic analogous to that applied by financial control departments to other spending categories. The third axis takes the issue to the team and organization level, arguing that two seemingly similar teams can perform very differently depending on how deeply, how widely and with how much oversight they have integrated AI into their processes.
The logic of this analysis implicitly assumes that artificial intelligence represents a permanent and ever-increasing wave of demand for capital and organizational restructuring, of the order that would justify increased investment in infrastructure, staff training and governance. In this context, the old distinction between those with and without access to AI licenses is losing relevance as access becomes near-universal, replaced by a distinction concerning depth, scope, and degree of organizational integration, whether a company has planned its operations around AI or merely procured it.
Christensen and Rudebusch's finding does not negate this organizational logic, which is about how a single firm should manage AI given its existence, not whether AI will change the equilibrium rate of the economy in the long run. The two levels of analysis, the microeconomics of the individual firm and the macroeconomics of the economy as a whole, are not logically contradictory; a technology may well radically change the way work is organized at the firm level without this yet translating into a measurable change in the equilibrium rate at the economy level, either because this effect takes longer to add up or because it is offset by other forces. However, the juxtaposition is a useful reminder that the certainty with which a sustained AI-driven output boom is being discussed in the organizational strategy space is not reflected, so far, in bond investors' expectations of the long-term real interest rate. The two narratives may coexist, but they do not confirm each other.
6. The Monetary Dimension: How FOMC Meetings Lost Their Grip on Long-Term Rates
The third explanation looks at a more indirect mechanism. Hillenbrand had shown that almost the entire long-term decline in US interest rates from 1989 to 2021 was concentrated in three-day windows around Federal Open Market Committee meetings, a finding that remains difficult to interpret given the principle of long-term monetary policy neutrality, according to which figures such as r* should not be dependent on central bank decisions in the long run.[38] The interpretation proposed by Hillenbrand himself is that the Fed's policy announcements, economic justifications and forecasts around meetings provide bond investors with a form of long-term guidance, through which they gradually learn about underlying macroeconomic trends.
The assumption has an important consequence for the interpretation of the previous two sections. If investors learn about long-term trends primarily through the Fed's guidance, then the absence of a strong r* reaction around the fiscal and technological events themselves would not necessarily mean that these events do not matter, but that their information is belatedly incorporated, at a time when the Fed is focusing the market's attention on it. In such a case, the absence of change would reflect inertia in the reaction of investors, who need the central bank's guidance to concentrate their attention, rather than mere indifference to the events themselves. Following this logic, Christensen and Rudebusch examined whether investors are integrating fiscal and technology news primarily around Commission meetings, where market attention is focused on long-term trends, rather than around fiscal and technology news itself. Extending Hillenbrand's analysis to 2025 showed that the normality he had described has collapsed in this decade. While before the pandemic changes around meetings explained most of the long-term decline in yields, both in nominal ten-year bonds and, as this study shows for the first time, in the r* estimates themselves, from 2020 onwards the cumulative changes around Federal Open Market Committee (FOMC) explain nothing of the recent rise.[39] In contrast, the windows around the Fed's meetings have been recording a mild downward trend in r* this decade, with the four estimates falling 6 to 39 basis points from their lows in their respective windows, which, as the authors note, further deepens the mystery rather than solves it. This finding suggests that bond investors have become less reliant on the Fed's guidance to assess long-term returns, perhaps because they are now drawing information from sources other than the central bank's announcements.
The statistics support this interpretation. In the sample from July 1997 to December 2019, the average daily changes within the three-day windows around the meetings were negative and statistically significant for almost all the variables examined, from the five-year and ten-year returns to the four estimates of r, while the changes outside these windows were negligible. In the sample from January 2020 to September 2025, however, the picture changes markedly: changes within the meeting windows remain negative for most variables, but are now largely not statistically significant, while the estimates of r outside the Fed's windows now show a positive, no longer zero, sign.[40] In other words, the rise in the natural interest rate is now taking place mainly on days that are not close to meetings of the FOMC, an exact opposite pattern from what Hillenbrand described for the pre-pandemic period.
7. An Enigma That Remains Open: Beyond Fiscal, AI and Monetary News
All three categories of events, fiscal, technological and monetary, fail to explain the rise of r* during this decade. Fiscal news exerts mild and statistically insignificant upward pressure. AI news is associated with a fall, not a rise, in the natural interest rate. Monetary policy, which has historically concentrated long-term investor adjustments, has ceased to play this role after 2020. The authors acknowledge that this effect could partly reflect sample constraints, misclassification of events, or imperfections in the r* estimates themselves. Taken as it stands, however, the finding suggests that the recent rise in real interest rates remains an enigma, especially given that some long-standing demographic and other structural forces continue to exert downward pressure on real interest rates.
The authors themselves, without concluding on the source of the rise, outline several directions for future research. A first direction concerns how investors incorporate information into their expectations. The Congressional Budget Office's official cost estimates or AI model release announcements may not be the most important stimuli used by investors; unlike discrete monetary policy announcements, fiscal and technological developments may shift expectations more pervasively, through corporate earnings announcements, rumors and gradual social adoption rather than through isolated news events.
A second direction concerns the shift in perspective towards global, not just domestic, forces, given that the r* seems to have risen in this decade in many countries, not just in the United States, as shown by separate studies for the eurozone and Canada, which record a similar upward turn in the natural interest rate using different methodologies and different national data.[41, 42] The fact that the phenomenon is not limited to the United States weakens the explanations based solely on domestic American factors, such as US fiscal policy and reinforces the possibility that some common, transnational force is behind the rise. The authors cite as possible candidates changes in global saving and investing, a potential trend of de-globalization in which Asian exporters and oil producers are reducing their portfolios of Western assets, the increase in the inflation risk premium following the unexpected wave of inflation that followed the pandemic and the increased investment needs for the transition to a low-carbon economy.[43] None of these assumptions are empirically examined in the present study; they are merely listed as directions that would be worth exploring further. The authors also note that, according to separate research by the Federal Reserve Bank of New York, shifts in investor perceptions of the security, liquidity and sovereign debt facility of advanced economies also explain very little of the recent rise in r*, a finding that further narrows the list of possible explanations that have already been empirically tested and found to be insufficient.[44]
8. Conclusion - What The Search For An Explanation Reveals About The Natural Rate
The study itself insists on not offering an answer and this persistence is perhaps its most intriguing element. At a time when the AI narrative tends to offer ready-made explanations for nearly every economic phenomenon, from the rise of stock markets to the trajectory of interest rates, Christensen and Rudebusch's findings act as a counterweight. They accept that AI is changing how businesses operate and that companies are reorganizing around it, which is described extensively in other literature around managing AI agents, measuring the value of using it per task and planning the distribution of dependence on it among teams. What they are showing is something more concrete and more modest: that the bond market, which prices the long-term expectations of millions of investors every day, has not so far embodied a belief that artificial intelligence will lead to permanently higher demand for capital and therefore to a permanently higher natural interest rate. If this happens in the future, it should first be seen there, in the market data themselves and not just in the intentions and investments of businesses.
The parallel organizational debate, the one about who manages digital agents, how the value of AI use is measured per job and how reliance on AI is distributed among teams, often describes access to AI as the old, outdated criterion of separation between businesses that benefit and businesses that are left behind and the depth of organizational integration as the new. Christensen and Rudebusch's finding adds another layer to this observation, albeit on a different scale of analysis. Even if a company has managed to deeply integrate AI into its processes, this does not necessarily mean that the broader economy, or the investors who monitor it, have already priced in a corresponding permanent shift in overall capital demand. The organizational readiness of a business and the macroeconomic validation of a technological narrative remain, at least for the time being, two separate questions and one does not prove the other.
There is one more point of contact between the two discussions that is worth noting, although it remains indirect. Organizational analysis on AI often points to a phenomenon called the AI shadow economy, in which employees use personal AI tools for their work much more widely than official corporate licenses indicate, resulting in the actual intensity of technology use within businesses being largely invisible to those trying to measure it officially. If something similar is true at the level of the overall economy, i.e. if the actual diffusion and intensity of AI use is greater than the official adoption indicators monitored by analysts can conceive, then the study's difficulty in linking visible model release events to changes in r* could partly reflect this same inability to measure, not necessarily the absence of a real economic impact. This is a conjecture that the authors themselves do not formulate and that the present study does not examine empirically, but which naturally arises from the comparison of the two debates and reminds us that measurement, not just the existence of a technological change, remains the most difficult part in both cases.
References
[1] Rachel, L. and Smith, T.D. (2015) 'Secular Drivers of the Global Real Interest Rate', Bank of England Staff Working Paper No. 571.
[2] Laubach, T. and Williams, J.C. (2016) 'Measuring the Natural Rate of Interest Redux', Business Economics, 51(2), pp. 57-67.
[3] Obstfeld, M. (2025) 'Natural and Neutral Real Interest Rates: Past and Future', IMF Economic Review, 73, pp. 339-392.
[4, 8, 15] Del Negro, M., Giannone, D., Giannoni, M.P. and Tambalotti, A. (2017) 'Safety, Liquidity, and the Natural Rate of Interest', Brookings Papers on Economic Activity, 48(Spring), pp. 235-316.
[5, 6, 7, 12, 14, 24, 25, 30, 35, 36, 39, 40] Christensen, J.H.E. and Rudebusch, G.D. (2026) 'Can Fiscal, AI, or Monetary News Explain the Rise in r*?', Hutchins Center Working Paper No. 112, Brookings Institution.
[9, 19] Christensen, J.H.E., Lopez, J.A. and Rudebusch, G.D. (2010) 'Inflation Expectations and Risk Premiums in an Arbitrage-Free Model of Nominal and Real Bond Yields', Journal of Money, Credit and Banking, 42(Supplement), pp. 143-178.
[10, 20] D'Amico, S., Kim, D.H. and Wei, M. (2018) 'Tips from TIPS: The Informational Content of Treasury Inflation-Protected Security Prices', Journal of Financial and Quantitative Analysis, 53(1), pp. 243-268.
[11, 21] Christensen, J.H.E. and Rudebusch, G.D. (2019) 'A New Normal for Interest Rates? Evidence from Inflation-Indexed Debt', Review of Economics and Statistics, 101(5), pp. 933-949.
[13] Bauer, M.D. and Rudebusch, G.D. (2023) 'The Rising Cost of Climate Change: Evidence from the Bond Market', Review of Economics and Statistics, 105(5), pp. 1255-1270.
[16] Cho, S. and Williams, J.C. (2025) 'Are Financial Markets Good Predictors of R-Star?', Liberty Street Economics, Federal Reserve Bank of New York.
[17] Gürkaynak, R.S., Sack, B. and Swanson, E.T. (2005) 'Do Actions Speak Louder Than Words? The Response of Asset Prices to Monetary Policy Actions and Statements', International Journal of Central Banking, 1(1), pp. 55-93.
[18, 38] Hillenbrand, S. (2025) 'The Fed and the Secular Decline in Interest Rates', Review of Financial Studies, 38, pp. 981-1013.
[22] Waller, C.J. (2024) 'Some Thoughts on r*: Why Did It Fall and Will It Rise?', speech at the Reykjavik Economic Conference, Board of Governors of the Federal Reserve System.
[23] Miran, S. (2025a) 'Nonmonetary Forces and Appropriate Monetary Policy', Board of Governors of the Federal Reserve System.
[26] Gomez-Cram, R., Kung, H. and Lustig, H. (2025) 'Can U.S. Treasury Markets Add and Subtract?', NBER Working Paper No. 33604, National Bureau of Economic Research.
[27] Wiegand, C. (2025) 'The Effect of Fiscal Policy Shocks on Asset Prices', Working Paper, Social Science Research Network.
[28] Romer, C.D. and Romer, D.H. (2010) 'The Macroeconomic Effects of Tax Changes: Estimates Based on a New Measure of Fiscal Shocks', American Economic Review, 100(3), pp. 763-801.
[29] Gust, C. and Skaperdas, A. (2024) 'Government Debt, Limited Foresight, and Longer-Term Interest Rates', FEDS Working Paper No. 2024-27, Board of Governors of the Federal Reserve System.
[31, 37, 43] Rachel, L. (2025) 'What Next for r*? A Capital Market Equilibrium Perspective on the Natural Rate of Interest', Brookings Papers on Economic Activity, forthcoming.
[32] Barr, M.S. (2026) 'What Will Artificial Intelligence Mean for the Labor Market and the Economy?', speech at the New York Association for Business Economics.
[33] Miran, S. (2025b) 'Interview: Fed Governor Stephen Miran on AI, Rates, and Stablecoins', The Blind Spot.
[34] Andrews, I. and Farboodi, M. (2026) 'Do Markets Believe in Transformative AI?', Working Paper, Massachusetts Institute of Technology.
[41] Brand, C., Lisack, N. and Mazelis, F. (2025) 'Natural Rate Estimates for the Euro Area: Insights, Uncertainties and Shortcomings', ECB Economic Bulletin, 1, pp. 73-78.
[42] Christensen, J.H.E., Rudebusch, G.D. and Shultz, P.J. (2025) 'Accounting for Changes in Long-Term Interest Rates: Evidence from Canada', Journal of Financial Econometrics, 23(2).
[44] Del Negro, M., Elbarmi, E. and Pham, M. (2026) 'The Post-Pandemic Global R*', Liberty Street Economics, Federal Reserve Bank of New York.