Free Cash Flow Is a Definition Before It Is a Number

Authored On
Modified
Free cash flow has no accounting standard, as the SEC acknowledges
Timing, acquisitions and lease rules can move it by billions
A reliable reading needs several years, the definition and all spending
When a retail investor explains why he prefers a stock, free cash flow most likely appears somewhere in his argument. This position is earned. Earnings can be formed through accruals, estimates and extraordinary charges, while cash either goes into the bank account or not. Free cash flow gives the feeling of a number that can't lie.
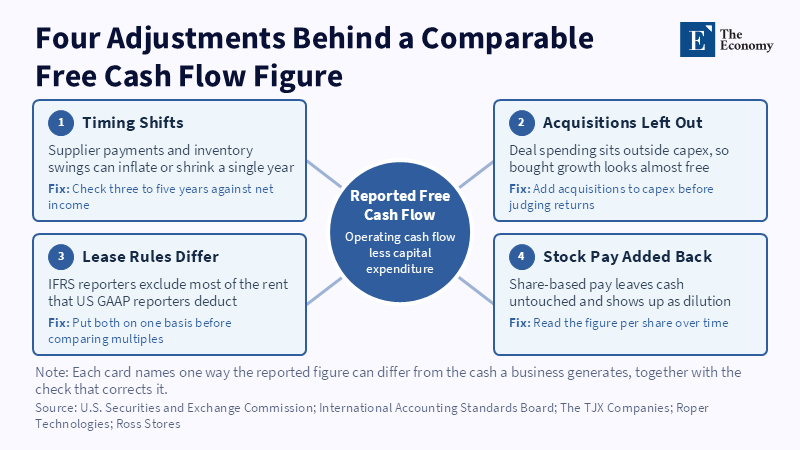
The difficulty lies elsewhere. Most investors read free cash flow as a fact about the business, whereas in practice they are the result of a definition. If the definition, timing, or accounting standard changes, the same company produces a very different number. The author develops stock analysis software and in his experience the most common mistake is rarely a bad model. Much more often it is a correct model fed with a figure that means something different from what the investor assumes. Four mechanisms cause this discrepancy time and time again and each is clearly seen in data taken directly from the companies' annual reports, along with a practical way to correct it.
Free Cash Flow Has No Standard Definition and the Regulator Says So
Revenue, net income and operating cash flow are defined by accounting standards, while free cash flow is not defined by any standard. The U.S. Securities and Exchange Commission (SEC) ranks them as non-GAAP measures. This means that each company calculates them on its own.
The SEC's staff is unusually clear on this point. In Question 102.07 of its non-GAAP guidance, it notes that free cash flow is typically calculated as cash flows from operating activities, as presented in the GAAP cash flow statement, less capital expenditures. It then cautions that the term " free cash flow " does not have a uniform definition and its title does not describe how it is calculated." The directive goes even further. Companies should not imply that free cash flow is the remaining cash amount for discretionary expenses, since debt repayments and other mandatory payments are not deducted from it. In addition, they are not allowed to present it on a per-share basis at all.
Private investors do everything the warning describes every day. They compare free cash flow between companies that define them differently. They treat it as money that the company can freely return to shareholders and divide it by the number of shares. None of this is necessarily wrong. But it is precisely the reading that the regulator asks companies not to encourage and the reason is worth understanding.
The analysis below uses the simple textbook definition: operating cash flow minus purchases of tangible assets, equipment and capitalized software. All figures are from companies' 10-K reports, as highlighted in the SEC's XBRL data and each figure can be independently checked
Misread One: Supplier Timing That Looks Like Earning Power
TJX Companies, owner of T.J. Maxx and Marshalls, offers the clearest example of how working capital deteriorates in a single year. In the fiscal year ending January 2021, TJX stores were closed for long periods due to the pandemic. Net income collapsed to $90 million. Operating cash flow came in at $4.56 billion.
Table 1: TJX Net Income, Accounts Payable and Free Cash Flow, Fiscal 2021 to 2023
| Fiscal Year Ended | Net Profit | Change in Liabilities to Suppliers | Operating Cash Flow | Capital Expenditure | Free Cash Flow |
|---|---|---|---|---|---|
| Jan 2021 | 90 | +2,111 | 4,562 | 568 | 3,994 |
| Jan 2022 | 3,283 | −338 | 3,057 | 1,045 | 2,012 |
| Jan 2023 | 3,498 | −600 | 4,084 | 1,457 | 2,627 |
The discrepancy is not hidden and is in the working capital lines of the cash flow statement. Accounts payable increased by $2.11 billion that year, meaning that TJX held cash that it owed to suppliers. That cash was real and was in the bank. But it was never profit, since they were essentially borrowed interest-free from the supply chain. Over the next two years, accounts payable fell by $938 million and TJX spent $1.66 billion to rebuild its inventory, with free cash flow declining with it.
A filter that ranked companies based on twelve-month free cash flow at the beginning of 2021 would show TJX generating nearly $4 billion of free cash flow with a profit of $90 million. A year later, earnings had increased more than thirty-fold, but free cash flow had halved. Neither year alone showed what the business earns and the two together come much closer to the real picture.
The phenomenon is not unique to TJX. Ross Stores went through the same fluctuation in the same year, with a net income of $85 million. Operating cash flow was $2.25 billion. Accounts payable increased by $939 million. Ross Stores' cash flow statements for subsequent years show the reversal. In fiscal year 2022, $753 million was returned to inventory and in fiscal year 2023, accounts payable decreased by $365 million. The same effect appears more quietly in any company that delays payments to suppliers, collects advances from customers, or reduces inventories shortly before the reporting date. Starting in 2023, U.S. companies that use vendor financing programs, where a bank pays the supplier early and the company repays the bank later, are required to disclose outstanding amounts in the notes to financial statements. This note is worth reading before any reliance on a jump in operating cash flow.
The practical correction is simple, since free cash flow should never be judged by one year. Three to five years side by side, as presented in TJX's cash flow statements and a comparison of the total with the total net income of the same period give a much more useful picture. In the three years of the table, TJX's free cash flow totaled $8.63 billion, compared to a net income of $6.87 billion. This ratio says much more than any single line.
Misread Two: The Acquisition Spending That Free Cash Flow Leaves Out
Free cash flow removes capital expenditures, but not acquisitions. For most companies, the difference is small. For those that grow by buying other companies, it is the biggest part of the picture. Roper Technologies has built much of its long-term growth model around acquisitions of niche businesses, increasingly in vertical software. The free cash flow it reports is excellent, but the picture changes when placed next to the cash it spent on acquisitions.
Table 2: Roper Technologies Free Cash Flow against Acquisition Spending, 2024 and 2025
| Roper Technologies | 2024 | 2025 | Two Years |
|---|---|---|---|
| Operating cash flow | 2,393 | 2,540 | 4,933 |
| Capital expenditure and capitalized software | 111 | 105 | 216 |
| Free cash flow | 2,282 | 2,436 | 4,718 |
| Acquisitions, net of cash acquired | 3,613 | 3,290 | 6,903 |
Note: Amounts are in millions of U.S. dollars. Totals may not add up exactly because of rounding.
Over those two years, Roper spent $6.9 billion on business purchases, while its free cash flow was $4.7 billion. The free cash flow margin stood at about 31% of revenue in 2025 and the figure is accurate. But it does not show that maintaining the growth rate required acquisition expenses about one and a half times greater than free cash flow. These expenses were financed in part with the $4 billion in senior notes issued by the company in the same two years.
The remark is not a criticism of Roper. Acquisitions are its capital-allocation strategy and its track record shows that it manages them successfully. But an investor who labels this free cash flow "available to shareholders" makes exactly the conclusion the SEC warns against. For a serial buyer, the amount of free cash flow counts less than the return the company earns on the free cash flow and debt it reinvests in acquisitions. These are different numbers and only the second shows whether the strategy is working.
The same logic applies to capitalized software, which Roper records separately from the equipment line. Some data sources remove it and others don't. That's why the definition behind the number has the same meaning as the number itself.
Misread Three: How the Lease Standard Changes the Answer
This misreading is less discussed than the rest, although it can move free cash flow by 40% without any change in the business. According to the U.S. standard ASC 842, a company's payments for operating leases, such as store leases, go through operating cash flow. In this way, they reduce free cash flow like any other operating cost. According to the international standard IFRS 16, almost every lease is treated as a loan. The principal portion of each payment is classified as financing cash flow and only the interest portion can remain in operating activities. Starting in 2027, the new IFRS 18 standard also removes this option for most companies, transferring the interest paid to financing activities.
The result is that the free cash flow of an IFRS-reported company excludes the majority of its leases, while those of a US-GAAP-reporting company include them. For a retailer, the difference is far from a rounding error. In the fiscal year ending January 2026, TJX's reports show operating lease payments of $2.21 billion and an operating lease obligation of $10.62 billion. at the end of the year. With a weighted average discount rate of 3.9%, these figures allow for a rough conversion of its free cash flow into IFRS terms.
Table 3: TJX Free Cash Flow under U.S. GAAP and Estimated IFRS Terms, Fiscal 2026
| TJX, Fiscal Year Ended January 2026 | $ Million |
|---|---|
| Free cash flow as reported under U.S. GAAP | 4,917 |
| Operating lease payments | 2,214 |
| Estimated interest portion, average lease liability × 3.9% | about 400 |
| Estimated principal portion | about 1,810 |
| Free cash flow in IFRS terms, interest in operating activities | about 6,730 |
| Free cash flow in IFRS terms, interest in financing activities | about 7,130 |
Note: Amounts in IFRS terms are estimates. Short-term and variable lease payments have not been adjusted.
The method is an approximation. IFRS 16 treats short-term and variable payments differently and the estimate of interest is based on an average balance. The order of magnitude, however, is clear. With the same stores and the same cash, TJX would have 37% to 45% higher free cash flow if it prepared its statements like a European retailer.
When an investor compares a U.S. retailer to a European retailer based on the price-to-free cash flow ratio, the European company appears cheaper. Part of this discount is simply that rents that its cash flow statement moved to another section. The fair comparison requires that both companies first put themselves on the same footing, usually by subtracting lease payments from the free cash flow of the IFRS-reported company and only then compare the multiples.
Misread Four: The Stock-Based Cost That Never Touches Cash
Stock-based compensation is added back to operating cash because they are not paid in cash. They are paid in shares and so costs are shown as dilution rather than an outflow. For TJX and Roper, the issue is of little importance. TJX's stock-based compensation was $214 million in the most recent fiscal year, about 4% of free cash flow and Roper's was $166 million, about 7%. In many software and web companies, the same line accounts for a quarter or more of free cash flow and in some years absorbs it entirely. Two companies with the same free cash flow can be worth very differently for a shareholder if one issues 3% more shares each year to pay its staff.
Table 4: Stock-Based Compensation as a Share of Free Cash Flow, TJX and Roper Technologies
| Company | Fiscal Year | Stock-Based Compensation | Free Cash Flow | Ratio |
|---|---|---|---|---|
| TJX | Year ended January 2026 | 214 | 4,917 | 4.4% |
| Roper Technologies | 2025 | 166 | 2,436 | 6.8% |
The correction is to track free cash flow per share over time or deduct stock-based compensation before comparing companies. This is where the SEC's per-share rule works the other way around. Because companies can't post free cash flow per share, the calculation is left to investors and many never do.
None of the above is to say that free cash flow is a bad measure. They remain the closest measure of an annual report to the cash a business generates and are harder to manipulate than profits, but they need the same attention as any other number. Before any comparison between companies, the definition must be known: whether only capital expenditures or even capitalized software are deducted and whether leases follow U.S. GAAP or IFRS rules. When a company publishes its own figure, the answer comes from the reconciliation to GAAP figures required by the SEC. Because working capital moves in both directions, comparing three to five years of free cash flow to net income from the same period counteracts most timing effects. For serial buyers, acquisitions are added to capital expenditures, since what is at stake is the return on all the cash that is reinvested. In technology especially, dilution requires a per-share reading or subtraction of stock-based compensation.
The same caution applies to anything built on free cash flow, since a valuation is as reliable as the cash flow from which it starts. In a valuation of TJX, the first decision is not about the discount rate or the growth rate. It is about which free cash flow will be the starting point and whether they reflect a normal year. Measured from fiscal year 2022 to fiscal year 2026, TJX's free cash flow growth is about 25% year-on-year, while measured from fiscal year 2021 it falls to about 4%. The same company and the same reports thus give an assumption of growth that differs by six times and the entire distance between 4% and 25% is due to the year chosen as the starting point.
Disclosure: The author is affiliated with Intrinsiqq, a stock analysis platform. This article contains no platform promotion or comparative claims about providers. Statements based on the author's professional experience rather than published sources are identified as the author's experience.
The views expressed in this article are those of the author and do not necessarily reflect the views of The Economy, its Editorial Board, or any affiliated institution.
Disclosure: Philip van den Berge is the founder and CEO of Intrinsiqq, a stock analysis platform working in this field. This article is an analysis rather than advocacy. It contains no platform promotion or comparative claims about providers.
References
Financial Accounting Standards Board (2016) Accounting Standards Update No. 2016-02, Leases, Topic 842. Norwalk, CT: Financial Accounting Standards Board.
Financial Accounting Standards Board (2022) Accounting Standards Update No. 2022-04, Liabilities, Supplier Finance Programs, Subtopic 405-50: Disclosure of Supplier Finance Program Obligations. Norwalk, CT: Financial Accounting Standards Board.
International Accounting Standards Board (2016) IFRS 16 Leases. London: IFRS Foundation.
International Accounting Standards Board (2024) IFRS 18 Presentation and Disclosure in Financial Statements. London: IFRS Foundation.
Roper Technologies, Inc. (2025–2026) Annual Reports on Form 10-K, Fiscal Years 2024 and 2025. Sarasota, FL: Roper Technologies, Inc.
Ross Stores, Inc. (2021–2023) Annual Reports on Form 10-K, Fiscal Years Ended January 2021 to January 2023. Dublin, CA: Ross Stores, Inc.
The TJX Companies, Inc. (2021–2026) Annual Reports on Form 10-K, Fiscal Years Ended January 2021 to January 2026. Framingham, MA: The TJX Companies, Inc.
U.S. Securities and Exchange Commission, Division of Corporation Finance (2022) Non-GAAP Financial Measures: Compliance and Disclosure Interpretations, Question 102.07. Washington, DC: U.S. Securities and Exchange Commission.