U.S. Shale Oil Supply: Why Higher Prices Failed to Lift Output

Working across research, policy, and data-driven analysis, the Editorial Board ensures that published pieces reflect a consistent institutional perspective grounded in quantitative reasoning and long-term structural assessment.
Authored On
Modified
U.S. shale supply barely responded to soaring oil prices
Operational delays and futures prices constrained rapid production growth
Short-run oil prices remained driven mainly by demand

The average time between the arrival of a drilling rig in a shale oil field and the first oil production is 5.7 months, while only 0.8 percent of drilling is completed within a month. When the war in Iran caused international oil prices to soar sharply in the spring of 2026, many analysts expected U.S. shale oil production to grow rapidly, capitalizing on its reputation as a fast producer with growth cycles much shorter than those of conventional or offshore fields. Data from March through May did not bear out this expectation. Shale oil production remained virtually unchanged, calling into question the U.S. role as a supply regulator in times of geopolitical crisis and reinforcing an alternative explanation for the price rise itself, centered on demand rather than supply.
The Case for Fast U.S. Shale Oil Supply
The belief that shale oil acts as a fast supply regulator rests on a specific economic model. A study by the U.S. Energy Information Administration, based on a net present value analysis for an NPV analysis covering major U.S. shale oil plays, found that the number of economically viable drilling sites exhibits about twice as much price elasticity relative to the volume of proven reserves. In other words, a rise in the price of oil immediately makes many more marginal drilling sites viable than the change in total inventories would suggest, a finding that fueled the image of an industry ready to respond immediately to any price signal.
The most convincing element of the narrative concerns the already drilled but incomplete wells, known internationally by the acronym DUC. Because the most expensive and time-consuming stage, drilling itself, has already taken place, the breakeven price for an average-productivity DUC was 39 percent below that of a new well. This difference reinforced the hypothesis that the DUC reserve functions as readily available spare capacity, ready to be activated as soon as prices warrant it, without the delay involved in drilling from scratch.
In practice, even the study itself noted that companies do not automatically invest once the price reaches the breakeven threshold, a caveat that proved to be more critical than initially seemed. The same model also warned that the picture varies significantly by formation. In some basins the supply elasticity proved to be very low even at the theoretical level, while in others it approached the unit only at very low prices, where few drilling positions remained viable. The average picture that dominated the public debate obscured this heterogeneity, turning a relationship with many exceptions into a general rule of velocity that did not correspond to any particular formation.
The Operational Limits of Shale Production
Drilling completion data from the analysis company Kayrros, covering 21,299 wells across the U.S. oil basins in 2023 and 2024, give a much more subdued picture of shale oil production. The median time from the drilling rig's arrival to the start of production is 5.7 months, with just 0.8 percent of drilling completed within a month. This period does not even include the extra month or two usually required to prepare the drilling site before the drilling rig even arrives, which makes any productive response within the first month after a price shock virtually non-existent.
Nor do already drilled wells offer the speed attributed to them. The same data show a median time of 1.4 months from the arrival of a completion crew to the completion of the well, with a maximum of eight months, not counting the additional time required to schedule the completion crew. In February 2026, there were a total of just 2,357 such wells across the country, a number that in March rose slightly to 2,381 rather than shrinking, just the opposite of what would be expected if companies were rushing to empty inventory in favor of high prices.
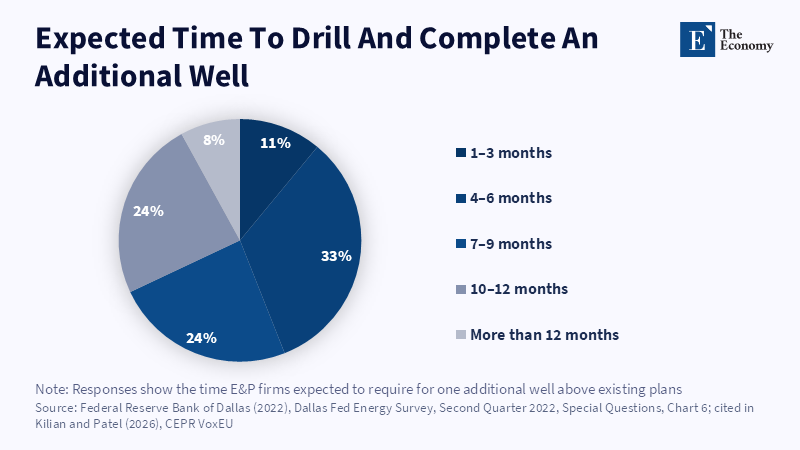
A Federal Reserve of Dallas survey of oil company executives confirms the same picture from a different perspective. They were asked how long it would take to drill and complete an additional well above existing plans and the most common answer ranged between four and six months, with over half of executives saying it would take more than six months. The convergence between the drilling data and the companies' own statements leaves little room for the assumption of a rapid response within the first month or even the first quarter after the outbreak of a crisis.
This picture does not contradict the theory, but confirms it. A study in the Journal of Political Economy had shown earlier that the short-term elasticity of oil supply is expected to be zero whenever the adjustment of production entails real costs, which is almost always true in practice due to the need to find drilling rigs, crews and capital. Earlier analysis of well-level panel data, published in the Energy Journal, had already come up with a quarterly elasticity close to zero before even the Iran war, so the spring 2026 finding looks less like an exception and more like a confirmation of an already documented pattern.
Forward Prices Weakened the Incentive to Expand
The decision to drill or complete a well doesn't depend on the current spot price, but on the price that is expected to apply at the time the well actually starts producing, five or six months later. At the end of March 2026, futures for WTI futures for 2027 delivery were trading near $67 a barrel, almost at the same level as the price that applied just before the outbreak of the war, according to Bloomberg market data. This flat price curve meant that a producer who would commit a drilling rig or completion crew for a drilling rig with no immediate yield had no solid incentive to lock in the temporary spot-price spike.
Price tension remained locked at the front end of the curve, not transmitting to the time horizon where investment decisions are actually made in the shale oil sector, which explains why the drilling-level reaction was much more like the flat forward curve than spot price fever in the headlines.
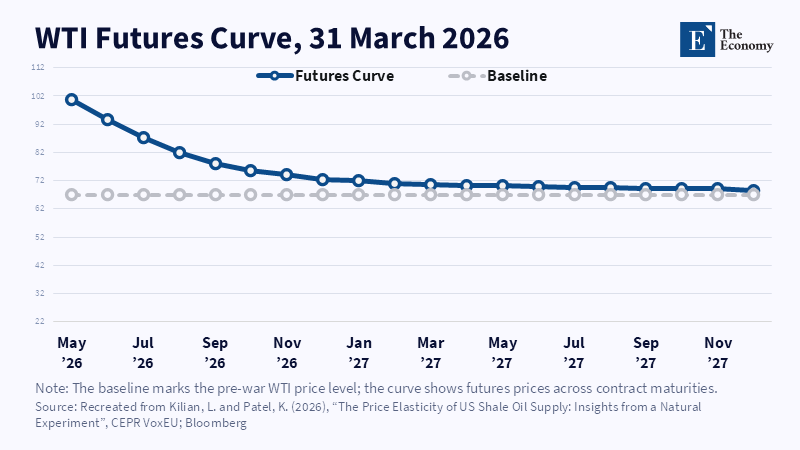
The same logic applies to the annual horizon, beyond the first month or first quarter of the war. Even if a producer temporarily ignored adjustment costs and planned with a time horizon of the whole of 2026 and 2027, the price curve did not offer them any additional incentive beyond what was the case before the outbreak of the conflict. This made any appreciable adjustment in supply unlikely even over a twelve-month horizon, which explains why the static picture of production expanded well beyond the first quarter with no signs of change.
The DUC Test for Higher Elasticity Estimates
Some recent econometric studies have come up with much higher estimates of short-term supply elasticity. A study in the Journal of Applied Econometrics estimated the monthly supply elasticity of shale oil in North Dakota at as high as 0.9, while a newer study in Quantitative Economics, based on a broader dataset, reported an upper bound of 0.62. Both rely on the difference between the forward and spot prices as an additional explanatory variable, interpreting it as an indication that producers are strategically reducing the stock of unfinished wells whenever the difference warrants it.
The arithmetic behind this interpretation does not stand up to scrutiny. To reproduce an elasticity of 0.62 would require the completion of over 12,000 unfinished wells in a matter of weeks in March 2026, when across the country there were only 2,357, a number that even increased rather than decreased. Even a more conservative reassessment of the same model specifically for March 2026 results in an elasticity of around 0.12, a rate that would require the completion of about 2,400 boreholes within two weeks, a rate that the drilling completion data itself excludes.
There is an additional element that further complicates the higher estimates. Only 10 percent of the semi-finished drilling completions in the Kayrros sample took place within three weeks and there are indications that even this percentage is inflated due to measurement errors in the field data. A scenario of rapid pumping of the DUC inventory would assume completion rates many times higher than that seen in even the most optimistic subcategory of drilling, which is not confirmed by any field dataset.
Near-Zero Elasticity and the Global Oil Market
Because U.S. shale oil production largely determines marginal supply in most models of the global oil market, a near-zero short-term elasticity in this industry implies that global supply elasticity also remains close to zero over the same time horizons. For market analysts, risk managers and energy policymakers who rely on shale oil as an automatic regulator against geopolitical disruptions, this finding means that this mechanism simply does not activate in the time window that counts during a crisis.
The difference has an immediate cost for those who plan around the possibility of rapid hedging. Managers of commodity portfolios that are positioned in anticipation of a rapid price de-escalation due to U.S. supply ignore the five- to six-month time frame that drilling data itself shows. The same is true for government plans that count on increased domestic production as an alternative to releasing strategic emergency reserves, an option that remains ineffective for as long as the first quarter of a supply disruption lasts.
The finding also recasts how to read the price fluctuation itself during the war. With supply essentially stable in the short term, the rise and subsequent decline in oil prices mainly reflect shifts in demand, through precautionary purchases and changing expectations for the duration of the conflict, rather than any adjustment on the production side. Global oil market models that incorporate near-zero supply elasticity, built largely on data before the shale oil era, ultimately prove to be more compatible with what happened in practice than models that assume significant regulatory capacity on the supply side.
The median time from rig arrival to first production is 5.7 months and it takes a new shale oil well to reach production, regardless of whether the price signal that triggered the decision proves to be permanent or temporary. The stock of unfinished wells, instead of shrinking during the war, increased slightly from 2,357 to 2,381, a detail that in itself reverses the picture of an industry ready to rush to recover the high price.
Shale oil continues to operate on a calendar of months, not days or weeks, while the geopolitical disturbances considered here unfold precisely in this shortest time. This difference between the time it takes the industry and the time it takes a crisis remains the element that any analysis of the global oil market must now take seriously.
This article reflects the analytical judgment of The Economy Editorial Board and does not constitute policy advice or the official position of any affiliated institution.
References
Australian Broadcasting Corporation (2026) ‘Anti-immigration sentiment rises in Japan despite growing demand for foreign workers’, ABC News, 8 June.
Chai, P. (2026) ‘As Japan’s popularity booms, a new survey shows strong anti-foreigner sentiment’, The Conversation, June.
Immigration Services Agency of Japan (2026a) Number of Foreign Residents as of the End of 2025.
Immigration Services Agency of Japan (2026b) Revision of Residence Permit Fees Effective 1 October 2026.
Japan National Tourism Organization (2026) Visitor Arrivals to Japan, December and Full Year 2025.
Kobayashi, T. (2026) ‘How Japan’s anti-immigration politics runs on imported narratives’, East Asia Forum, 9 September. The publication and date are independently confirmed by Waseda University.
Ministry of Health, Labour and Welfare (2026) Notification Status of Foreign Workers as of End-October 2025.
Ministry of Justice (2026) Nationality Q&A.
Ministry of Justice, Research and Training Institute (2025) White Paper on Crime 2025.
Ronkin, N. (2026) ‘Japanese Public Sets High Bar for Immigrants’, Stanford Freeman Spogli Institute for International Studies, 30 March.
Statistics Bureau of Japan (2026) Preliminary Counts of the 2025 Population Census of Japan, 25 June.
Working across research, policy, and data-driven analysis, the Editorial Board ensures that published pieces reflect a consistent institutional perspective grounded in quantitative reasoning and long-term structural assessment.