Geopolitical Shocks and Inflation: The Magnitude of the Crisis Determines the Price Path

Working across research, policy, and data-driven analysis, the Editorial Board ensures that published pieces reflect a consistent institutional perspective grounded in quantitative reasoning and long-term structural assessment.
Authored On
Modified
Energy-channel geopolitical shocks raise prices; demand-channel shocks lower them
Only large shocks trigger nonlinear uncertainty and expectation effects
Iran war inflation remains concentrated in energy, not core

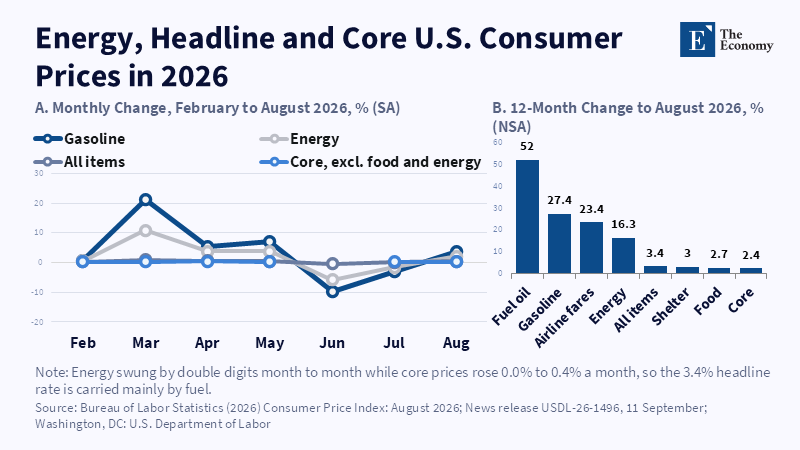
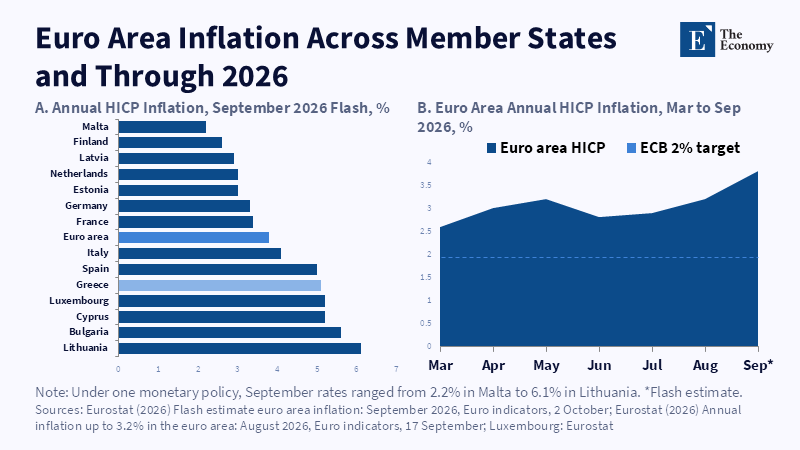
In March 2026, in just one month, the gasoline price index in the United States rose by 21.2% and the overall energy index by 10.9%, according to the Bureau of Labor Statistics. Six months later, annual US inflation stands at 3.4%, while Eurostat's first estimate for September puts the eurozone at 3.8%, with energy 18.8% more expensive than a year ago. The explanation that circulates almost automatically is that the war with Iran, like the Russian invasion of Ukraine before it, produces inflation and in this way geopolitical shocks and inflation are treated in the public debate as two sides of the same movement. Recent central bank research does not support this connection unconditionally. Some geopolitical shocks drive up prices, others push them down and the result is decided by two quantities that rarely fit into the same sentence: the channel through which the crisis passes and how big it is.
What Broke in 2022 in the Central Bank Model
Since October 1979, when Paul Volcker's Federal Reserve shifted its policy to tight control of the money supply, the central banks of advanced economies have learned to treat inflation as a primarily demand-driven phenomenon. Quantitative targeting was gradually abandoned in the 1980s and the key interest rate became the central tool, while in the years of Alan Greenspan the long period of low and stable inflation became known as the Great Moderation. The logic was simple and for three decades it worked: when the economy overheats, an increase in the interest rate limits spending, expectations remain anchored around the 2% target and prices return to their place.
This balance was broken in 2022. In June of that year, US inflation reached 9.1%, the highest annual increase since November 1981 and in October the eurozone recorded 10.6%. The reason was not an overspending economy but the skyrocketing price of natural gas after the interruption of Russian flows and the turmoil in grain markets caused by the blockade of Ukrainian ports, a supply shock on a scale the developed world had not seen since the oil crises of 1973 and 1979. A higher interest rate does not produce gas or open a sea passage. It can only reduce demand enough that expensive energy is not transferred to wages and other prices and the cost of this choice is paid in production and employment. Hence the habit of identifying every new conflict with a new wave of high prices.
Two Types of Geopolitical Shock with Opposite Effects on Prices
After the attacks of September 11, 2001, geopolitical risk, as measured by the index constructed by Dario Caldara and Matteo Iacoviello of the Federal Reserve from the coverage of the international press, skyrocketed. The price of oil fell. This observation is the starting point of a study by the Banque de France, published this year in the Journal of International Economics, which examines 31 major geopolitical events since 1986 and records how the risk index and the price of crude moved within a three-day window around each. When they rise together, the market anticipates a disruption in energy supply and the episode is characterized as a geopolitical energy shock, like the Gulf War and the invasion of Ukraine. When risk rises while oil falls, the market reads something else, a deterioration in the global economy's outlook that will curb demand for fuel.
The two types of shocks share a characteristic, as they both reduce industrial production. In prices, however, they move in opposite directions. The energy shock works like a classic negative supply shock and raises the consumer price index by about 0.2% at its peak, while the shock that passes through the general economic situation looks like a drop in demand and reduces it by 0.1% to 0.4%, depending on the time horizon. A sector-level test strengthens the interpretation, since after energy shocks the most energy-intensive sectors of manufacturing, with typical examples being basic metals and refined products, see their production fall by up to 3% and producer prices rise by more than 1%, while after a shock of the second type this difference almost disappears. The same conflict can therefore produce different inflation in different countries, depending on their energy mix and their dependence on imports.
Why the Magnitude of Geopolitical Shocks Changes Their Path to Inflation
The distinction between energy and macroeconomic shocks answers the question of which channel the crisis travels through, but it leaves open how strongly it travels. At this point, a study published by the European Central Bank in its series of working papers, with authors from the ECB itself, the Bank of England and the Autonomous University of Barcelona, adds the missing variable. With monthly US data from 1970 to 2023, the researchers show that the effects do not increase in proportion to the magnitude of the shock. A disturbance of one standard deviation, corresponding to an increase in the geopolitical risk index of about 20%, leaves the economy almost unaffected and up to two standard deviations a simple linear model satisfactorily describes what is happening. In more than half a century of data the shock exceeded two standard deviations eighteen times, while only four episodes reached or exceeded four: the Yom Kippur War in 1973, the Gulf War, September 11, which corresponds to eight standard deviations and the war in Iraq.
In these large episodes, a channel that remains almost silent in the small ones is activated: uncertainty. For shocks of four standard deviations, stocks fall about 3% on the first reaction, versus 0.8% predicted by the linear model and the VIX volatility index rises by about 3 points instead of less than one. At eight standard deviations the VIX rises 14 points, stocks lose 10%, real consumption almost 2% and industrial production about 3%, when the linear estimate does not even reach 1%, while the policy rate falls by about one and a half percentage points as the Fed reacts to the collapse in activity. Households and businesses postpone purchases and investments until the landscape clears up, so a local episode with limited global impact hardly touches energy supply or consumer behavior, while a major war changes both.
The most interesting finding concerns prices themselves, which on the whole react positively but moderately, because the geopolitical risk index contains two components that cancel each other out. Realized acts, meaning attacks and invasions that have already occurred, bring down the price of oil, inflation expectations and ultimately the price index, behaving like a demand shock. Threats of something to come do the opposite, raising speculative demand for oil and expectations for next year's inflation and this effect grows disproportionately with size, reaching the core of prices that excludes energy and food.
Ukraine, Iran and the Problem with Averages
The strongest objection comes from the Federal Reserve team that created the index itself. With nearly 5,000 observations for more than 40 countries since 1900, Caldara, Iacoviello and colleagues find that after a typical spike in geopolitical risk inflation rises and GDP falls and that a shock the size of the Russian invasion raised global inflation by about one percentage point, reducing global output by about 1%. The finding is solid, but it is an average and an average that throws energy shocks and demand shocks, small local incidents and major wars into the same basket says little about the next specific event. The Fed's own researchers also show, with counterfactual scenarios in their model, that some of the inflation that follows crises comes from the policy response, from military spending, increased debt and faster growth in the money supply and not from the conflict itself.
The ECB's analysis leads to a similar conclusion for 2022. In the historical decomposition of US data after the invasion of Ukraine, the net contribution of the geopolitical shock is limited and most of the price rise is attributed to a broader supply shock, in a country that was much less dependent on Russian energy than Europe and was coming out of the pandemic at the same time. The war with Iran is a different case, because it directly threatened navigation in the Strait of Hormuz and moved through the energy channel from the beginning.
The 2026 data show how tightly inflation remains tied to this channel. In the United States, the energy index rose 10.9% in March, fell 5.7% in June and rose again by 2.1% in August, while core inflation excluding energy and food fell to 2.4% year-on-year, even with gasoline more expensive by 27.4%. In the eurozone, with energy at 18.8%, the corresponding index was at 2.5% in September. The picture fits a large energy shock that has not yet spilled over into all prices and whether it will spill over depends on expectations, the very point where the ECB study identifies the strongest non-linear reaction.
What It Means for the Fed, the ECB and Energy-Intensive Industries
On September 10, the ECB raised its three key interest rates by 25 basis points, bringing the deposit facility rate to 2.50%, while staff projections put average inflation at 3.0% for 2026, 2.5% for 2027 and 2.1% for 2028, with growth of just 0.9% this year. The decision is consistent with what the research on energy shocks suggests, where the Banque de France's recommendation is tightening when the energy channel dominates and easing when the shock mainly passes through demand, always weighed against the risk of recession. Size complicates the weighting. The ECB's study concludes that as the shock grows, the dilemma between stabilizing output and containing prices intensifies and in its model, after very large shocks, the US policy rate moves down despite rising prices, an indication that monetary authorities have historically given more weight to activity.
For policymakers, the practical conclusion concerns the order in which the data are read. Crude and natural gas prices in the first days after an escalation show whether the market fears a lack of supply or a drop in demand and the distinction between a threat and a realized act indicates which channel will prevail as the crisis grows. Each country's exposure matters just as much, as shown by the first estimate for September, where Greece recorded 5.1% and Spain 5.0%, while Malta remained at 2.2% and Finland at 2.6%, under the same conflict and the same monetary policy. For basic metals and refining companies, where sectoral data show that most of the damage to production and prices is concentrated, hedging of energy costs and long-term supply contracts take on a different weight when the crisis touches the Gulf or the Black Sea, much more than in an incident that raises the risk index without moving a single tanker.
The 21.2% rise in gasoline in March was the first, clear indication of the kind of shock that had begun. It was an energy shock, it came from the heart of the world's oil supply and it was of the magnitude that, according to the ECB's research, triggers non-linear responses in expectations. The war with Iran causes inflation because it combines both characteristics. A conflict of similar intensity away from energy routes would likely have left behind a drop in demand and lower prices, as happened in the fall of 2001.
The open question is whether inflation will remain confined to energy. The ECB's projections give a first indication, since for 2027 they place inflation excluding energy and food at 2.6%, above the headline rate of 2.5%, which means that Frankfurt expects energy to ease before the rest of the price basket. The Bureau of Labor Statistics report for September, scheduled for October 14, will show whether core inflation continues to run below the headline rate or whether the spillover has begun.
The views expressed in this article are those of the author(s) and do not necessarily reflect the official position of The Economy or its affiliates.
References
Board of Governors of the Federal Reserve System (2026) Federal Reserve issues FOMC statement. Press release, 16 September. Washington, DC: Board of Governors of the Federal Reserve System.
Brignone, Davide, Gambetti, Luca and Ricci, Martino (2025) Geopolitical risk shocks: when size matters. ECB Working Paper Series No. 2972. Frankfurt am Main: European Central Bank.
Bureau of Labor Statistics (2026) Consumer Price Index: August 2026. News release USDL-26-1496, 11 September. Washington, DC: U.S. Department of Labor.
Caldara, Dario, Conlisk, Sarah, Iacoviello, Matteo and Penn, Maddie (2026) 'Do geopolitical risks raise or lower inflation?', Journal of International Economics, 159.
European Central Bank (2026) Monetary policy decisions. Press release, 10 September. Frankfurt am Main: European Central Bank.
Eurostat (2026) Flash estimate euro area inflation: September 2026. Euro indicators, 2 October. Luxembourg: Eurostat.
Pinchetti, Marco (2026) 'Geopolitical risk and inflation: the role of energy markets', Journal of International Economics.
Working across research, policy, and data-driven analysis, the Editorial Board ensures that published pieces reflect a consistent institutional perspective grounded in quantitative reasoning and long-term structural assessment.