Data Centers and Electricity Bills: Who Really Pays?

Working across research, policy, and data-driven analysis, the Editorial Board ensures that published pieces reflect a consistent institutional perspective grounded in quantitative reasoning and long-term structural assessment.
Authored On
Modified
Data centers raise household electricity prices, but unevenly across utilities
Nonprofit utilities show almost no residential price effect
Water impact is documented in volumes, not household bills
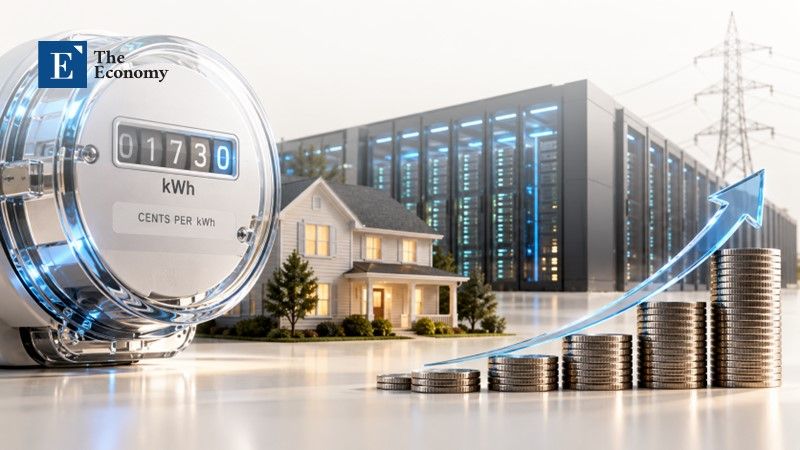
The average electricity price for US households rose from 13.15 cents per kilowatt-hour in 2020 to 17.30 cents in 2025, which is almost a third in nominal terms, according to the U.S. Energy Information Administration. In the same five years, data center construction accelerated sharply and the coincidence of data centers and electricity bills climbing together quickly became an issue on city councils, at election rallies and in research offices. Every electricity bill that arrives higher than before at a Virginia household is now read as a sign of guilt for a particular building full of servers, sometimes fairly and sometimes hastily. The available measurements now make it possible to check whether this reading applies and for whom exactly.
Data Centers and Electricity Bills: A Long List of Suspects
Fuel costs, extreme weather and an aging network appear first in an analysis of retail price trends published in 2025 by The Electricity Journal, with first author Ryan Wiser and the same analysis found no clear evidence that the increase in demand, including data centers, is responsible for the price trajectory. Harvard Law School has been arguing since March 2025 the opposite: that utility companies are already passing on the costs of tech giants to the public. The 2025 figures do not help a neutral observer, since residential electricity prices rose by 7.1 percent, more than double inflation and exceeded 20 percent in some states, as recorded by Consumer Reports based on federal data. The same magazine asked a representative sample of 2,146 adults in November 2025 and 78 percent said they were worried that the new centers would raise their energy bills.
The theory doesn't close the argument. A utility with excess power can handle a large load without a noticeable impact on the average charge and fixed costs, spread over more kilowatt-hours, can even drive down the price. When power runs out, the same load pushes up the peak and imposes a more expensive purchase or grid investment recouped by consumers. Size matters: a 100-megawatt hyperscale center consumes, according to the International Energy Agency, as much as 100,000 households, while the Lawrence Berkeley National Laboratory estimates that by 2028 data centers may be absorbing as much as 12 percent of U.S. electricity. A law professor at Penn State Dickinson Law explained in July 2026 that in Pennsylvania, the initial shock of upgrading infrastructure is shared by all consumers, while wholesale prices in the large PJM market are rising in parallel.
A single bill says little. A resident of Manassas, Virginia, received a bill of $281 in January 2026, up from about $100 the previous month and worries that charges will continue to rise as demand from data centers grows, as recorded by Consumer Reports. A winter month, however, can carry heating, seasonal tariffs and fuel clauses, so the amount on paper does not distinguish the price per kilowatt-hour from the consumption itself. The distinction requires a comparison between areas that received centers and areas that did not, with prices tracked over time and this is what a team of researchers from Columbia and Bocconi universities and the RFF-CMCC European Institute on Economics and the Environment attempted.
What the Comparison of 1,200 Service Areas Showed
From 2021 to 2024, an average of 216 new data centers were commissioned per year in the U.S., 70 percent more than the 2015 to 2020 rate, while private construction spending reached about $18 billion per year, more than double the previous average. Growth was extremely uneven: the median service area did not add a single center in a decade, while northern Virginia utilities added more than 290 together. The researchers matched electricity prices from about 1,200 geographically defined utility territories for the years 2015 to 2024 with about 2,700 centers in operation because retail prices are set at that level rather than the county or state level, which the most cursory comparisons overlook.
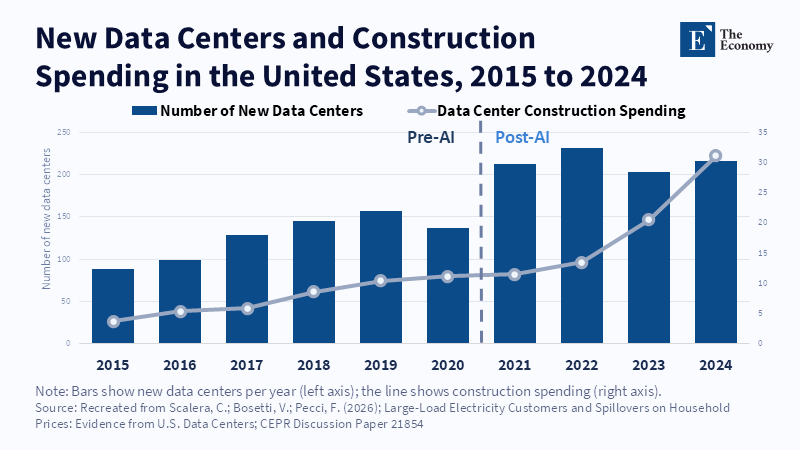
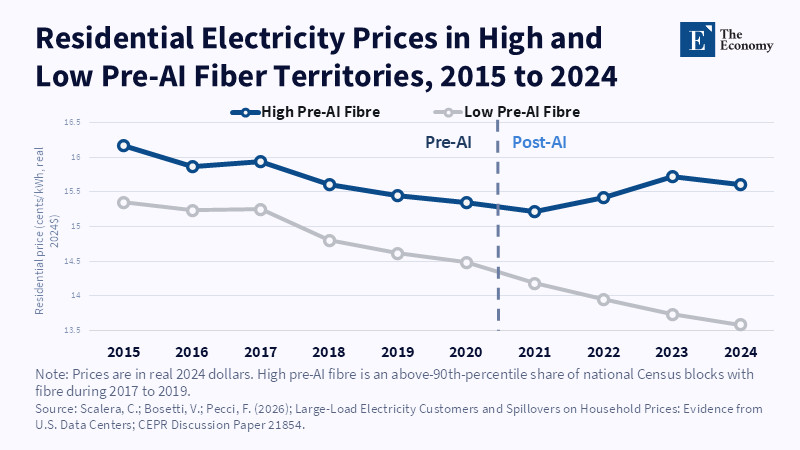
Data centers do not choose a location at random, since they are looking for cheap land, proximity to customers and favorable price trends and that is why the simple comparison is misleading. To overcome the hurdle, the team combined the national explosion of construction spending after 2021 with each region's share of the national fiber optic infrastructure before the age of artificial intelligence, with the logic that fiber affected where the centers would be built but not directly electricity prices. Before 2021, real prices were falling steadily in both high-fiber and low-fiber areas. After 2021, the two groups parted ways, since in the former, where growth was concentrated, prices began to rise and in the latter, they continued to fall. The picture alone does not prove causality, as the authors themselves note and the estimate is based on the assumption that fiber affects prices only through the location of the centers.
Each additional data center increases the residential price by 0.182 cents per kilowatt-hour. Ten additional installations, i.e. a standard deviation in the post-2021 stock, raise the price for households by 13 percent compared to the average for the period and an average hyperscale center, on a plot of about 24 hectares, adds around 4 percent. Industrial and commercial prices are also rising, but the increase for households is in absolute terms 30 to 40 percent higher, on top of a charge that was already higher. The mechanism can be seen in demand, since one facility adds about 34 megawatts to the summer peak, at a time when the grid is under the most pressure and leads the utility to raise distribution spending by about $11.6 million, an amount that reaches rates with a lag.
The Ownership of the Utility and the Distance from the Centers
In areas served by nonprofit utilities, i.e. cooperatives, municipal and state enterprises, the effect on household prices is almost zero. One possible explanation is that they rely more on fixed charges and less on volumetric prices exposed to the market. The effect is also smaller where the utility had a surplus of energy before the explosion, while in areas with historically more demand-sensitive prices the increase is more than twice the average. In the three states in the sample with substantial retail competition, Illinois, Ohio and Texas, the effect is about 44 percent smaller, but less precisely estimated. There was no indication that states with more wind and solar production have larger increases, which contradicts the concern that grids with many renewables absorb new loads worse, although the authors themselves acknowledge that they did not independently identify these factors.
Geography explains why the same national price of 17.30 cents says such different things at different points on the map. A household served by a cooperative or municipal utility, in an area without a new center, is outside the zone where the surcharge appeared, while a household served by an investor-owned utility in northern Virginia is inside it. Distance from the building, however, does not equate to distance from the market, because the same utility buys wholesale energy from a network that spans several states. In Pennsylvania, according to Penn State Dickinson Law, wholesale prices in the PJM market are rising due to demand even after the cap agreed for capacity auctions. Which of the two forces prevails in customers who are far from each center but within the same wholesale market, the available studies do not clarify.
The most common counterargument is that prices went up everywhere, so the causes are national and the data centers are innocent. The comparison based on fiber optics shows another picture: real prices, in 2024 dollars, were falling in both groups of areas before the explosion and after 2021 they continued to fall only where almost nothing was built. The national average, in other words, adds up to two different trajectories and the increase recorded in the country comes to a significant extent from the concentration areas. The analysis of Wiser and colleagues, however, remains standing as a warning to the rest of the map, since fuel, weather and aging infrastructure continue to count where no center grew.
Electricity and Water: Two Bills with Unequal Elements
Water enters the conversation through another door. According to estimates by the U.S. Environmental Protection Agency, as presented by Consumer Reports, a large center can use up to 5 million gallons of water a day, as much as about 16,000 households and that's just for cooling. Ceres estimates that centers around Phoenix already consume about 385 million gallons a year and that the amount will reach 3.7 billion when the planned ones are operational, an 870 percent increase, in a city that gets 40 percent of its water from the Colorado River. The river's two large reservoirs, Powell and Mead, dropped from about 90 percent of their capacity in 2000 to about 30 percent today. Two-thirds of the centers built since 2022 are located, according to a Bloomberg News investigation, in areas with already limited water reserves.
As bills, the two goods are not easily compared. For electricity, there is a price estimate per kilowatt-hour, with causal design and margins of error, while for water, the sources examined report volumes and shortages and not a burden on the water bill, without offering a corresponding estimate for households. The water risk is likely physical first and financial later, since a river that is drying up does not initially appear as a charge. The two costs, however, tie together: cooling can account for up to 40 percent of a center's electricity consumption, according to Penn State and systems that consume less water often ask for more electricity, so a solution to one bill can burden the other.
What the Finding Means for Regulators, Utilities and Households
The researchers propose capacity expansion, centers with flexible consumption hours and large-load tariffs that would force centers to pay for network upgrades they demand. The finding for nonprofit utilities shows that cost allocation is judged in pricing processes, not press releases. A Harvard expert noted in Consumer Reports that the nonbinding ratepayer protection pledge, signed at the White House in March 2026 by companies such as Microsoft, does not change anything substantial, because the final decisions are made by utilities and state regulators. The states, however, are moving, after more than 300 data center bills were filed in over 30 states in 2026, according to Multistate, with issues ranging from temporary moratoriums to tax incentives.
For households, the practical information is the identity of the utility: whether it is a nonprofit or investor-owned, how the charge is divided into fixed and volumetric and whether there was a surplus of power before the center appeared. Developers, for their part, have reason to prefer areas with a surplus, where the burden on neighbors is less and the social reaction, which Data Center Watch, as reported by Consumer Reports, links to $98 billion of projects blocked or delayed between March and June 2025, less likely. Regulators of states that do not yet have large centers are in the most favorable position, because they can set the terms before the first connection and not after the first protest.
The 2025 price of 17.30 cents does not contain all of the costs already committed. The distribution costs of $11.6 million per additional center, in the limited sample of utilities for which data were available, will reach bills with the lag that characterizes pricing processes and the authors expect this channel to weigh more heavily in the coming years. How much of this cost will end up in rural cooperative households and how much in northern Virginia investor-owned utility customers will be judged by decisions that have not yet been made.
This article reflects the analytical judgment of The Economy Editorial Board and does not constitute policy advice or the official position of any affiliated institution.
References
Greenfield, N. (2026) 'AI data centers: Big Tech's impact on electric bills, water, and more', Consumer Reports, 20 March.
Martin, E. and Peskoe, A. (2025) 'Extracting profits from the public: how utility ratepayers are paying for Big Tech's power', Environmental and Energy Law Program, Harvard Law School, 14 March.
Scalera, C., Bosetti, V. and Pecci, F. (2026) 'Large-load electricity customers and spillovers on household prices: evidence from U.S. data centers', CEPR Discussion Paper 21854.
Tkacik, T. (2026) 'Ask an expert: are data centers driving up my electricity bills?', Penn State University, 7 July.
US Energy Information Administration (2026) Monthly Energy Review, August 2026, Table 9.8: Average prices of electricity to ultimate customers.\
Wiser, R.H., O'Shaughnessy, E., Barbose, G.L., Cappers, P. and Gorman, W. (2025) 'Factors influencing recent trends in retail electricity prices in the United States', The Electricity Journal, 38(4).
Working across research, policy, and data-driven analysis, the Editorial Board ensures that published pieces reflect a consistent institutional perspective grounded in quantitative reasoning and long-term structural assessment.