China and Fossilflation: How Renewables and Coal Kept Rates Still

Working across research, policy, and data-driven analysis, the Editorial Board ensures that published pieces reflect a consistent institutional perspective grounded in quantitative reasoning and long-term structural assessment.
Authored On
Modified
China cut oil use without cutting mobility
Renewables and coal filled the missing energy
Beijing held rates while Frankfurt and Seoul hiked
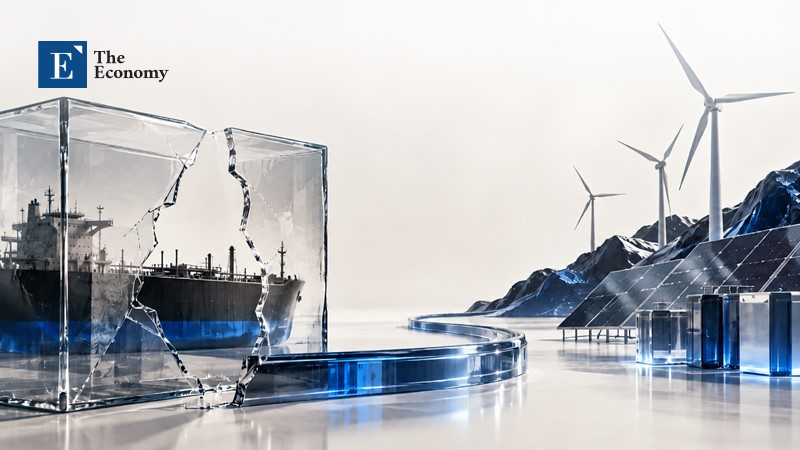
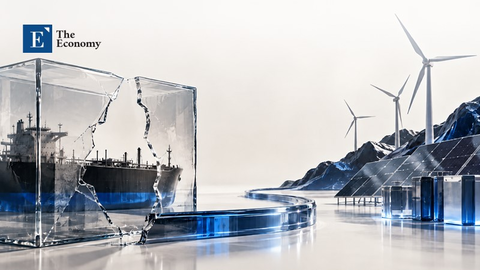
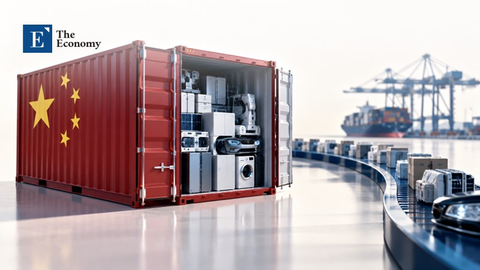
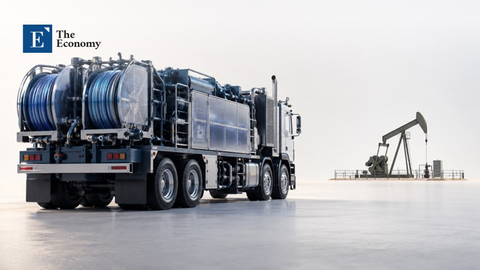
In the second quarter of 2026, China burned 9% less oil than a year earlier and in transport the drop reached 16%, according to data from the National Bureau of Statistics processed by the Centre for Research on Energy and Clean Air, known as CREA. In the same period, urban passenger travel increased 2.9% and freight volumes 2.4%. An economy that imports about 70% of its oil and almost half from the Gulf, lost a third of crude imports after the closure of the Strait of Hormuz without stopping moving. In August, Chinese consumer inflation was 0.8%, when in the eurozone it stood at 3.2%, with energy rising 14.3% year-on-year. Markets already have a name for this distance: "fossilflation", the inflation transmitted through fossil fuels and China seems to be eluding it in a way that few had predicted in early spring.
The explanation lies in how the energy gap was filled. Part was absorbed by reserves, a larger part came from the electrification of transport with electricity increasingly produced by sun, wind and water, while a part that is difficult to ignore was lifted by coal, which increased in electricity production in the spring even as domestic mining declined. For monetary policy, the result is visible, since the European Central Bank and the Bank of Korea each raised their interest rates twice in the summer, while the People's Bank of China did not have to move.
One Shock in Hormuz, Two Different Asias
South Korea and Japan share with China the same key weakness: the absence of meaningful domestic oil and one would expect the shock to hit all three with similar intensity. The Bank of Korea raised the key interest rate from 2.50% to 2.75% on July 16, ending fourteen months unchanged and to 3.00% on August 27, stating that inflation would remain above target for a significant period of time and that its path depends on international oil prices and the exchange rate. In China, crude imports fell from about 12 million barrels a day on the eve of the war to less than 8 million in May and June, according to estimates by the US Energy Information Administration, a drop that in any other major economy would have immediately passed to the fuel pumps and from there, within a few weeks, to the consumer price index and central bank decisions.
Inventories explain part of the difference. Beijing entered the crisis with about 1.4 billion barrels in tanks, an amount equivalent to at least three months of imports, while the 32 members of the International Energy Agency had to coordinate the largest release in their history, more than 400 million barrels, to contain prices. In Chatham House's analysis, about 60% of the shortfall from imports that were not replaced was covered by storage. The remaining 40% was not covered at all, just less oil was burned and this piece matters to anyone trying to judge whether Chinese resilience is a temporary ploy or a structural feature. The tanks are emptying and at some point they have to be refilled, often at high prices, while a truck that is now powered by a battery will not return to diesel when the Straits open.
Electrification as a Barrier to Fossilflation
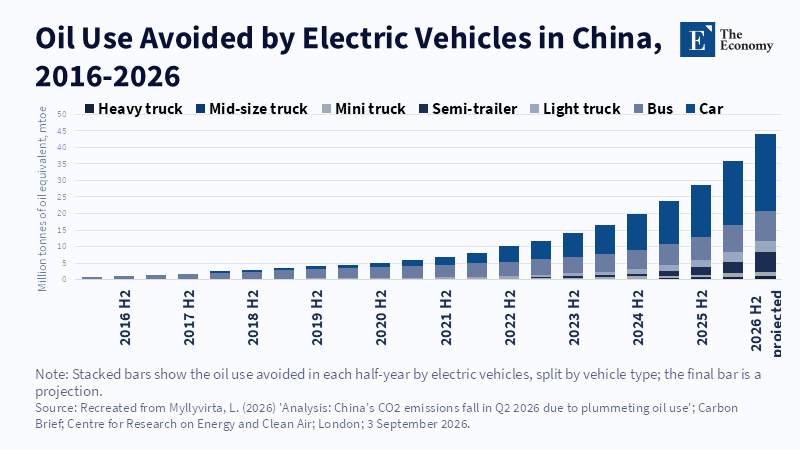
The electric vehicle fleet on Chinese roads was at the end of June 33% larger than a year earlier, with 12.1 million new vehicles, of which 8.1 million were purely electric. More revealing is how much they were used. Charging volumes increased by 60% in the second quarter, meaning that existing vehicles recorded more mileage at the expense of gasoline cars and that hybrid drivers preferred the plug to the pump. Sales of electric heavy-duty trucks rose about 77% in the quarter, with their share exceeding 45% of new sales, while in construction and mining diesel demand fell particularly sharply. Based on charging figures, CREA estimates that electric vehicles displaced 36 million tonnes of oil equivalent in the first half of the year, more than the UK consumes in six months.
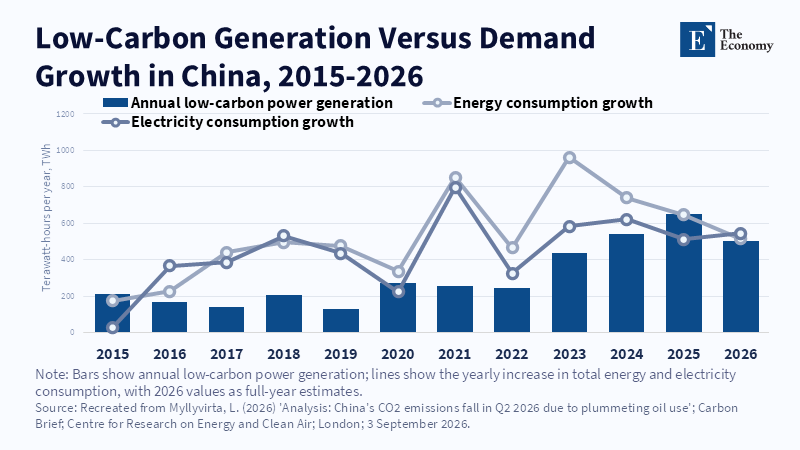
For inflation, the crucial question is where this electricity comes from and at what price. The National Energy Administration announced that in the first half of 2026, coal produced 49.7% of the country's electricity, below 50% for the first time, with hydroelectric production up 9% in the second quarter and nuclear by 2%. The first half's wind power additions exceeded those recorded by the country in any full year before 2025 and all new clean power capacity is on track to cover an increase in electricity demand of up to 5% in the year, when demand increased 5.3% in the six months. The sun and wind have no fuel costs that depend on navigation in the Persian Gulf, so every kilowatt-hour that an electric taxi moves in Beijing is a kilowatt-hour that is not priced in Brent. With this mechanism, the price of oil is decoupled, gradually and imperfectly, from the cost of mobility.
The Coal that Filled the Void in the Spring
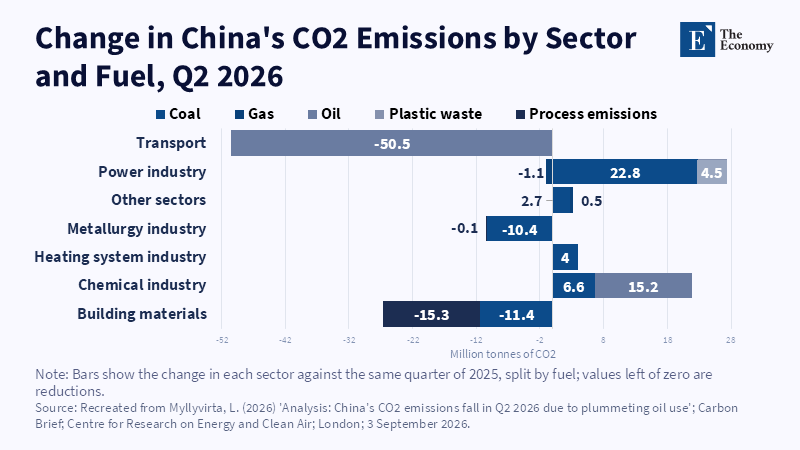
The picture of renewables remains incomplete without coal, which lifted a significant part of the burden in the spring. Coal consumption for electricity generation rose 2.4% in the second quarter, while production from natural gas fell, with the decrease reaching 18.1% in June as liquefied gas cargoes did not pass through the Straits and coal-fired power generation recorded six consecutive months of annual growth until June. Electricity sector emissions climbed 3.0% in the half-year. The cause lies in the waste of already installed renewable power, since the prices and volumes paid at the coal plants are locked months in advance, as well as the flows on the long-distance transmission lines, with the consequence that the grid is cutting back on solar and wind production to keep contracts with thermal plants. Without this obstacle and without the unusually weak wind conditions of the spring, coal power generation would have decreased.
The same pattern runs through major renewables projects in northwest China. According to a report by the Global Energy Monitor in July, the 11 planned ultra-high-voltage direct current lines for so-called "megabases" combine 129 GW of wind and solar power with 40 GW of coal and the energy they will transport is shared almost equally between the two sources. In the existing network of such lines, coal accounts for 42% of the energy transferred, with wind and solar around a fifth. In the first half of the year, 30 GW of new coal plants were put into operation, the highest level since 2016, less than 3 GW were retired and another 204 GW are under construction. Coal actually acts as insurance for the system and this insurance came in handy when gas was lacking, with costs in emissions and investments that will require hours of operation for decades to be amortized, something that the Chinese plans themselves have not yet decided how to reconcile with their goals.
Coal Output Falls and not Only for Green Reasons
On the supply side, the picture is moving in the opposite direction from electricity generation. Raw coal production by large industrial enterprises was 380 million tons in June, 9.7% lower than a year earlier and the biggest annual decline since 2016, while in July it fell another 10.1%, with the seven-month period closing 2.9% lower. July was also the first month after six in which coal electricity generation decreased by 2.5%, with solar production up 10.4%. Mining has now completed twelve months without an annual increase, which in other circumstances would read as a sign of a peak.
It would be hasty to interpret this decline as evidence that renewables are already displacing coal from mines. June's plunge followed the explosion in late May at a mine in Shanxi province, which claimed the lives of 82 people and led to extensive safety inspections in a province that produces about a quarter of the nation's coal. Coal imports increased by almost a third that month to fill the gap. The new five-year plans, moreover, loosen the previous commitment: in 2021 Beijing had said it would gradually reduce coal consumption over the period 2026 to 2030, with the goal now for consumption to "enter a plateau". The plan for electricity allows some provinces to cut up to 15% of wind and solar production, when the limit was 5% and only relaxed to 10% in 2024.
However, there are indications that the balance is slowly tilting towards renewables. The same plans provide for the first time for "reasonable control" of coal power generation itself and not just its growth rate, while the plan for renewables entrusts the reliability of the system to storage, flexible demand and virtual power stations instead of exclusively thermal plants. Installed battery capacity reached 153 GW with 17 GW of new capacity in the six months, but less than the 23 GW of the corresponding period in 2025 and the government goal is for electricity to cover 35% of final energy consumption by 2030, up from 30% in 2025.
Why Does the People's Bank of China not Follow Frankfurt
The European Central Bank raised the deposit rate to 2.25% on June 11, the first increase since September 2023 and to 2.50% on September 10, reversing part of the eight cuts that had brought the rate down from 4% to 2%. In August, energy contributed 1.29 percentage points to European inflation of 3.2%, while core inflation fell to 2.4%, meaning Frankfurt is tightening monetary policy in the face of a price increase driven primarily by imported fuels. The People's Bank of China kept its benchmark one-year lending rate at 3.0% and the five-year at 3.5%, unchanged for more than a year and the transport category in the Chinese consumer price index climbed just 2.5% in August.
The most serious objection is that low Chinese inflation is mainly due to weak domestic demand, falling house prices and high savings and little to no energy shielding. The consumer price index has been below the 2% target for more than three years and the data are partly correct in this reading: the producer price index rose 3.8% in August, with oil and coal processing 11.1% more expensive, so the shock reached factories. What did not happen was its transmission to households through motor fuels, the channel that in Europe and Korea turned energy inflation into a central bank problem. An economy that burns 16% less fuel on transport without moving less has narrowed precisely this channel, leaving the People's Bank with room to deal with weak demand instead of chasing the price of Brent.
For the central banks and finance ministries of Europe, Japan and Korea, the conclusion has practical content, since every electric truck and every renewable power supply contract reduces the share of the consumer basket that follows Brent and with it the frequency with which a geopolitical shock results in more expensive mortgages and deferred investments. Chatham House points out, however, that in 2024 China produced more than 90% of the world's polysilicon, wafers and solar cells, so the same recipe that protects against Hormuz creates dependence on another supply chain, less direct in prices but just as real for the pace of the transition.
The 9% drop in oil consumption in the second quarter was made possible by electricity coming partly from sun, wind and water and partly from coal plants that worked longer because the grid could not absorb all renewable production. That mix was enough to keep Chinese inflation below 1% and interest rates stagnant, while Frankfurt and Seoul were driving up the cost of money. How clean the next defense against a similar shock will be depends on two numbers moving in opposite directions, the 204 GW of coal plants under construction and a cap on cutting renewable generation that in some provinces rose to 15%. Monthly data on the cuts have not been released in recent months.
This article reflects the analytical judgment of The Economy Editorial Board and does not constitute policy advice or the official position of any affiliated institution.
References
Bank of Korea (2026a) Monetary Policy Decision, 16 July. Seoul: Bank of Korea.
Bank of Korea (2026b) Monetary Policy Decision, 27 August. Seoul: Bank of Korea.
Bloomberg News (2026) 'China coal mining output falls most in decade after deadly blast', Bloomberg, 15 July.
Centre for Research on Energy and Clean Air (2026a) China Energy and Emissions Trends: June 2026 Snapshot. Helsinki: CREA.
Centre for Research on Energy and Clean Air (2026b) China Energy and Emissions Trends: July 2026 Snapshot. Helsinki: CREA.
European Central Bank (2026) Monetary Policy Decisions, press release, 10 September. Frankfurt am Main: ECB.
Eurostat (2026) Annual Inflation up to 3.2% in the Euro Area, Euro indicators, 17 September. Luxembourg: Eurostat.
Geall, S. (2026) 'China is weathering the Hormuz energy crisis. But copying its model comes with risks', Chatham House Expert Comment, 17 September.
Kusnetz, N. (2026) 'China's carbon pollution fell in recent months as oil demand plummeted', Inside Climate News, 2 September.
Myllyvirta, L. (2026) 'Analysis: China's CO2 emissions fall in Q2 2026 due to plummeting oil use', Carbon Brief, 3 September.
National Bureau of Statistics of China (2026a) Energy Production in June 2026, 16 July. Beijing: NBS.
National Bureau of Statistics of China (2026b) Consumer Price Index and Producer Price Index, August 2026, 9 September. Beijing: NBS.
Xinhua (2026a) 'China's coal-fired power output share falls below 50 pct for first time in H1', 30 July.
Xinhua (2026b) 'China's loan prime rates remain unchanged', 20 August.
Yu, A. (2026) China's Wind and Solar Megabases Face a Coal Test. San Francisco: Global Energy Monitor.
Working across research, policy, and data-driven analysis, the Editorial Board ensures that published pieces reflect a consistent institutional perspective grounded in quantitative reasoning and long-term structural assessment.