Carbon Tax and Net Zero: Why Supply Chains Decide Who Pays

Working across research, policy, and data-driven analysis, the Editorial Board ensures that published pieces reflect a consistent institutional perspective grounded in quantitative reasoning and long-term structural assessment.
Authored On
Modified
Carbon costs travel through supply chains, not smokestacks
Net zero costs arrive early; inaction costs arrive late
Protection should follow network exposure, not direct emissions
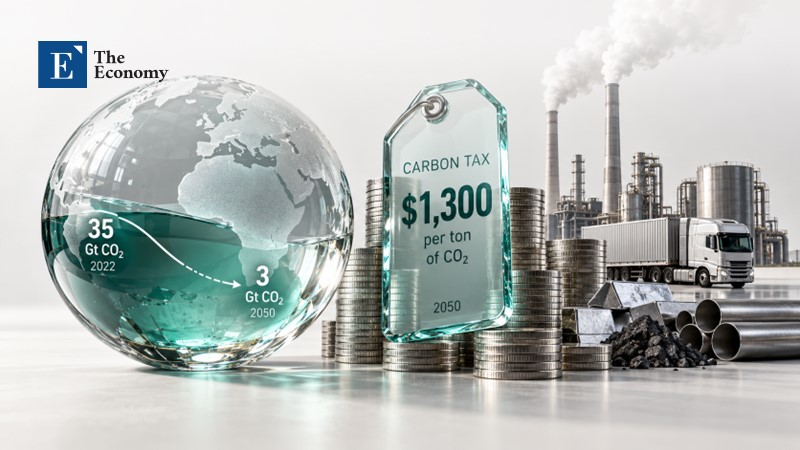
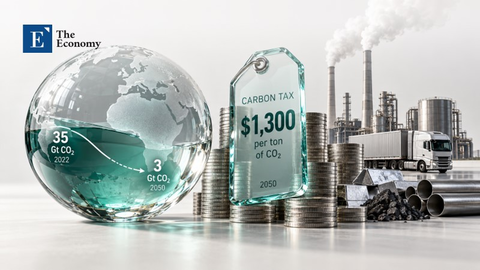
Global carbon dioxide emissions currently hover around 35 gigatons per year, while the Paris Agreement's goal of net zero by 2050 assumes a balance of about 3 gigatons. With a reduction of 8.37 percent per year from 2022, the path from the first number to the second is exactly 28 years and a rate of this magnitude is difficult to achieve without carbon pricing. The simulations result in a carbon tax that peaks at close to $1,300 per ton of CO2, ten times higher than any current price in any market. Less attention has been paid to which industries will actually foot this bill and the prevailing picture points towards the chimneys of the factories, i.e. towards the biggest direct polluters. Research into production networks leads to a different map, in which the position within the supply chain counts more than the smoke coming out of the industry itself.
The Smokestack Principle and Where It Breaks Down
The logic called the smokestack principle has a self-evident charm: whoever emits more pays more, so heavy industries need the most protection. In the European Union's Emissions Trading System, industries at risk of carbon leakage get free emission allowances and the selection criterion is mainly based on their immediate emission intensity, plus the electricity they consume. The carbon incorporated in the metals, chemicals or transport they buy is not counted. This protection is planned to be phased out from 2026 to 2034, so the question of who will be exposed first and hardest ceases to be academic and becomes a matter of industrial design with a deadline.
The reservation against this logic is not new. Researchers at the Bank of France showed in 2020, with a production network model for the French and European economy, that the sectoral burden of a carbon tax depends on the interconnections between inputs and outputs and not just on direct emissions. In CEPR's VoxEU, a 2025 study recorded that businesses react to the tax by shifting part of their supplies to more polluting foreign suppliers that are not taxed, while another study by the same forum showed that carbon pricing is already falling unevenly in European regions. A macroeconomic model that extends William Nordhaus's DICE framework with a detailed sectoral structure adds the rest of the piece, because it simultaneously monitors the overall economy and each sector separately on the path to 2050. The tax under consideration is Scope 1, i.e. it is imposed exclusively on direct business emissions and yet its weight does not stop there.
Laissez-Faire Versus the Paris Path to Net Zero
In the first scenario, laissez-faire, governments do not add any new climate policies. Emissions continue to accumulate, the temperature rises and the damage passes on to GDP in a way that at first seems mild. The recession starts small and steadily worsens as the damage grows, with the result that the economic burden shifts towards the end of the century. Without an additional carbon tax, no industry receives a new pollution bill in the coming decades. The cost is there, but it is recorded later and spread throughout the economy instead of being concentrated in specific sectors.
In the second scenario, a global carbon tax reduces emissions by 8.37 percent per year from 2022, leaving about 3 gigatons in 2050, an amount that the model assumes can be offset by non-model capture technologies. The tax is forced to rise sharply to about $1,300 per ton in 2050, a level that is in the same range as the recent revisions of the social cost of carbon by Bilal and Känzig, which came about with a completely different method. The mechanism works primarily by pushing businesses to invest in emission-limiting technologies and the tax may be relaxed after the peak. The cost comes early: GDP loses up to 8% by 2050, but in 2100 the recession is about 5 percent of GDP against about 8 percent under laissez-faire.
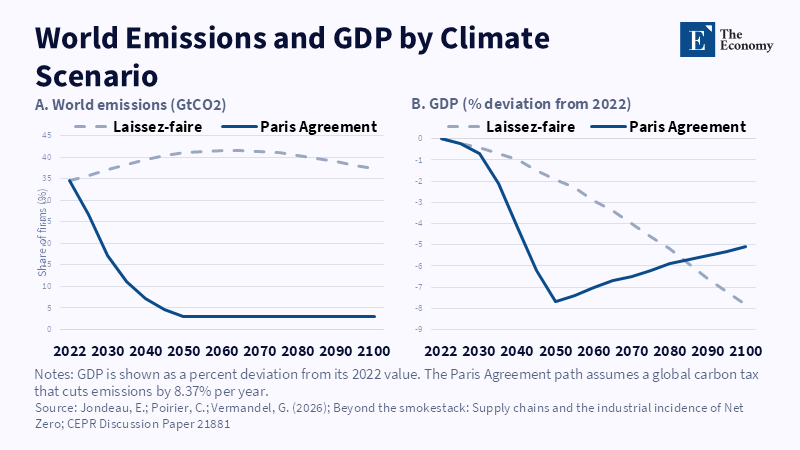
Comparing the two scenarios does not leave a painless choice. Laissez-faire postpones the damage to the end of the century, while the Paris scenario brings it to the next decades and loads it on specific sectors. But what these sectors are does not emerge from the direct emission percentages, as one would expect and the divergence is only apparent when the model follows the tax through the transactions between sectors, i.e. at the point where the next part of the analysis begins.
How Carbon Tax Is Transmitted Through the Production Network
The tax is imposed first on direct emitters, who owe an account for their own emissions. Part of the cost increase is passed on to the price of their products; buyers incorporate it into their own prices and pass it on to their own customers and the chain continues until final consumption. An industry's exposure depends on both what it buys and what it emits. An industry with low emissions of its own, which obtains large quantities of electricity, metals, chemicals or transport services from polluting producers, accepts the carbon tax indirectly but completely, while an industry with high emissions of its own and few polluting inputs may find itself in a better position than its chimney indicates.
The whole chain of effects is summarized in an indicator known as downstream emission centrality, or DEC. The index weighs how much a sector directly pollutes along with how much it depends on inputs that are themselves carbon-intensive. The sectors with the largest price increases and the sharpest drops in output, both in theory and data, are those with the highest DEC. Transportation, despite its high direct emissions, buys relatively few carbon-intensive inputs and is only moderately exposed. Other utilities show the opposite: their own emissions are modest, but their supply network is largely fueled by polluting suppliers, making them among the most exposed industries. A ranking based on direct emissions would put these two sectors exactly upside down.
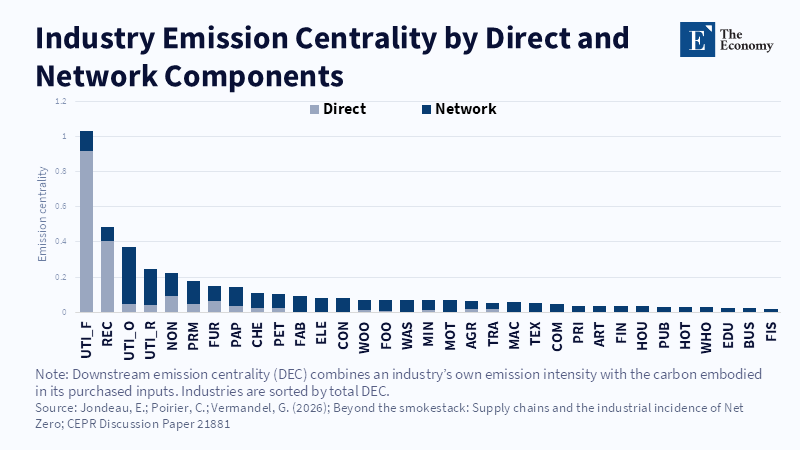
Quantitative confirmation shows a difference that is difficult to ignore: the DEC explains more than 99 percent of the cross-sectoral variation in price changes, while direct emission intensity explains 88%. The gap of eleven percentage points seems small until it is analyzed by sector, where it is concentrated in cases such as Primary Metals, which pollute moderately on their own, but their exposure is seriously underestimated when the ranking is based on direct percentages. For most sectors, most of the total exposure comes from the network component, i.e. from the carbon embodied in the inputs they buy. The clearest exception is the production of energy from fossil fuels, which stands out both for its direct emissions and for its central position in the network.
What Network Exposure Changes for Policy and Investment
For those planning protection measures, the first conclusion concerns the criterion. If free allowances or transition subsidies are allocated on the basis of direct emissions, they end up in sectors that are visible and noisy, while the sector most affected because its supplier pays expensive carbon does not appear anywhere on the list. The calculation of the DEC is based on input-output tables, which are published by national statistical offices, so changing the criterion does not require a new data infrastructure. For financial managers and investors, the corresponding conclusion is practical: a group's supplier map needs to record the carbon hidden in its inputs and not just the emissions that occur at its own facilities, before price increases reach invoices.
A reasonable objection argues that the direct intensity of emissions is transparent, easy to control and already explains 88% of price differences, so the more complex method offers a marginal benefit. The arithmetic shows the opposite, because the remaining percentage is not distributed randomly. It is concentrated in sectors in which the ranking is reversed, such as Transportation and Other Utilities and these sectors are exactly the ones for which protection decisions are made. An average that applies to the whole does not help a minister who decides for each one individually. The empirical literature also shows the risk of measurement at the first level, since the shift towards polluting foreign suppliers that are not taxed, as recorded in the 2025 VoxEU study, occurs within the supply chain itself.
There remains one point that the model does not solve. The simulated tax is global and uniform, while in practice carbon prices vary from country to country and exposure through imported inputs changes depending on where they are produced. Whether the DEC indicator will maintain the same strength when prices diverge remains open in the context of the results described.
The Net Zero Bill and What Remains Unsettled
The path from 35 to 3 gigatons has a price and this price reaches about $1,300 per ton in 2050, while GDP falls by up to 8 percent before the advantage of the Paris scenario begins to appear, which in 2100 has a recession of about 5 percent of GDP against about 8 percent under inactivity. These numbers describe the total. How the bill is distributed between industries is determined by their position in the supply chain and the ranking based on the chimneys is in the wrong order for Transportation and Other Utilities.
The protection of European sectors at risk of carbon leakage is completed in 2034 and the criterion that granted it counts direct emissions and purchased electricity, not the carbon embodied in other inputs. What is measurable today is that the DEC explains more than 99 percent of cross-sectoral price changes and 88 percent of the direct intensity of emissions, with the difference being concentrated in Primary Metals and sectors with a similar position in the network.
This article reflects the analytical judgment of The Economy Editorial Board and does not constitute policy advice or the official position of any affiliated institution.
References
Bilal, A. and Känzig, D.R. (2026) 'The macroeconomic impact of climate change: Global versus local temperature', The Quarterly Journal of Economics, 141, pp. 889-944.
Coster, P., Di Giovanni, J. and Méjean, I. (2025) 'Carbon leakage through firms' supply chain adaptation', VoxEU.org, 2 January.
Devulder, A. and Lisack, N. (2020) 'Carbon tax in a production network: Propagation and sectoral incidence', Banque de France Working Paper, No. 760.
Jondeau, E., Poirier, C. and Vermandel, G. (2026) 'Beyond the smokestack: Supply chains and the industrial incidence of Net Zero', CEPR Discussion Paper, No. 21881.
Konradt, M. and Mangiante, G. (2025) 'The unequal costs of carbon pricing in European regions', VoxEU.org, 2 May.
Nordhaus, W. (1992) The 'DICE' model: Background and structure of a dynamic integrated climate-economy model of the economics of global warming. Cowles Foundation for Research in Economics, Yale University.
Working across research, policy, and data-driven analysis, the Editorial Board ensures that published pieces reflect a consistent institutional perspective grounded in quantitative reasoning and long-term structural assessment.