The Cost Reset Behind the U.S. Productivity Surge

Working across research, policy, and data-driven analysis, the Editorial Board ensures that published pieces reflect a consistent institutional perspective grounded in quantitative reasoning and long-term structural assessment.
Authored On
Modified
U.S. productivity rose as firms removed pandemic-era excess
Higher utilisation may explain more than AI
The durability of the gains remains uncertain

Since 2022, productivity growth in the U.S. appears to have been robust. Output per hour has grown by around 2.5 percent per year, a full point faster than the rate for the period before the pandemic. Many credit artificial intelligence for that spike. Other numbers paint a more subdued picture. U.S. employers announced 1.2 million job cuts in 2025 alone. This was the highest count since the pandemic year of 2020. Meta shed 22 percent of its staff in 2023. Its revenue per employee then rose 63 percent over the next three years. Such figures raise an awkward question. Is the economy producing more? Is it producing roughly the same amount more efficiently, with fewer people? The answer has implications for how policymakers, investors and workers should interpret the recent productivity data. The evidence is less conclusive than the headlines on AI suggest.
A Productivity Growth Number That Does Not Add Up
Start with straightforward facts. Between 2005 and 2019, U.S. labor productivity expanded roughly 1.5 percent annually. Between Q1 2023 and Q1 2026, it expanded roughly 2.5 percent annually. The estimate comes from a growth-accounting analysis produced by the Federal Reserve Bank of San Francisco. The difference is stark, though mathematically consistent. Economists break down gains in productivity into three components. One component is labor quality. Another component is capital deepening. The final component is the residual: total factor productivity, or TFP. The acceleration is concentrated in TFP. That component alone added almost 0.8 percentage points to growth. Capital deepening added a smaller 0.3 percentage point.
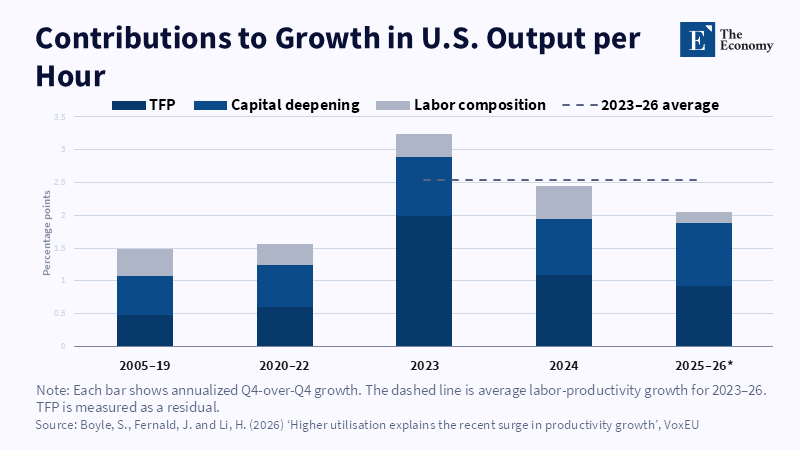
Labor quality contributed almost nothing. A rising TFP number sounds like innovation. In practice, it is simply the increase in productivity that growth in hours worked and investment in equipment cannot account for. It can be caused by new, better technology. It can also happen if companies take the same workers and machinery that they have always used and get more output out of them without any new invention, which makes an enormous difference to how one should interpret the current boom. Newer research from the San Francisco Fed suggests that most of the acceleration after 2022 is from this second mechanism, which it labels higher utilization rather than a genuine step change in technological efficiency. Firms may not have become more efficient; they may simply have been compelled to push staff and machinery to their limits because existing inputs could not keep pace with strong demand and uncertainty. That explanation fits the data well. It raises a glaring question: Why did firms retain workforces they could not fully use in the first place? Why did that correction close the gap just as many observers began attributing the surge to AI?
The Overhiring Bill Comes Due
The process was well underway before ChatGPT arrived. Between 2019 and September 2022, Amazon more than doubled its global workforce. It added more than half a million workers. It ramped up its warehouse infrastructure just as quickly. Meta's headcount almost doubled between March 2020 and 2022, ending with 86,482 staff assembled for a world that stayed cooped up. People ordered everything on the web. Teams worked entirely by video call. Companies had an unending need for new servers and office software to keep that world ticking over. As people finally trickled back to actual bricks-and-mortar shops and offices in 2022 and 2023, much of that buildout became unnecessary. The correction has been massive and enduring. Tech firms cut around 260,000 jobs in 2023 alone, according to layoff-tracking website Layoffs.fyi. That was just the beginning. Amazon cut 14,000 corporate positions in late 2025. It cut another 16,000 positions in early 2026. UPS cut 48,000 positions in 2025 and forecast another 30,000 cuts in 2026. Economy-wide unemployment rose from a trough of 3.4 percent in April 2023 to 4.3 percent in March 2026. That rise unfolded over 35 months. Labor economists often describe it as a low-hire, low-fire economy rather than a booming one. Taken together, this does not look like a labor market transformed by a sudden productivity breakthrough. It looks like a labor market undergoing a post-pandemic hiring correction.
Meta provides the most transparent single example. Its headcount fell from 86,482 in 2022 to 67,317 by the end of 2023. That is a 22 percent reduction during Meta's Year of Efficiency. Revenue per employee soared from $1.56 million in 2022 to approximately $2.0 million in 2023. It had reached $2.55 million by 2025, a 63 percent increase over three years. Company revenue also increased substantially over the same period, from $116.6 billion in 2022 to roughly $201 billion in 2025. Therefore, it was not purely austerity against stagnant output; a substantial part of the increase in revenue per employee came directly from having fewer employees. If an overhiring correction does this to one household name, it can probably do something similar across other large firms that overhired three years ago and are only now reducing that excess.
A second cost adjustment came through firms' changed use of office space. In 2023, only about 5 percent of the Fortune 100 required employees to be in the office five days a week; in 2025, this was the case for over half. Firms that had set up remote-first systems, purchased additional software licenses and paid for home-office stipends began moving employees back into shared spaces. Executives pointed to gains in in-person productivity and mentoring. Virtual infrastructure once viewed as a permanent transformation was instead scaled back, written off or left unused. Combined with headcount reductions, this second cost-restructuring channel produced a similar effect: lower virtual overhead and output concentrated in leaner teams. Job-openings data tell the same story from another direction. Job openings topped out at a record 12.1 million in March 2022, exactly at the peak of the pandemic hiring spree. The ratio of job openings to unemployed job seekers, a widely used Fed indicator, peaked that summer at around 2.0. By late 2025, job openings had fallen to between 6.5 million and 7.1 million and the ratio had dropped to around 0.9, its lowest number in years. Layoffs remained contained even as job openings and hiring plunged, in what economists call labor hoarding. Firms were not rushing to cut more workers. They were more reluctant to hire, having already hired too many two years ago. This is not the hallmark of firms finding a quick new way to work. It is the hallmark of firms now cleaning up a surplus they have created themselves.
What Higher Utilization Leaves Out
Neither account necessarily contradicts the utilization story. Both accounts make the same central point. The productivity spike has mostly come from firms using available inputs more effectively. It has not come from a wave of new technology raising the productivity of every hour of work. The two accounts differ over what available inputs mean and how utilization became so high to begin with. The San Francisco Fed story sees the workforce as a fixed size. It has firms make that fixed workforce work harder during periods of uncertainty. The overhiring correction story sees the workforce as mis-sized; pandemic overhiring was a poor estimate of the system's equilibrium level. Removing excess labor increases output per remaining worker without requiring increased effort.
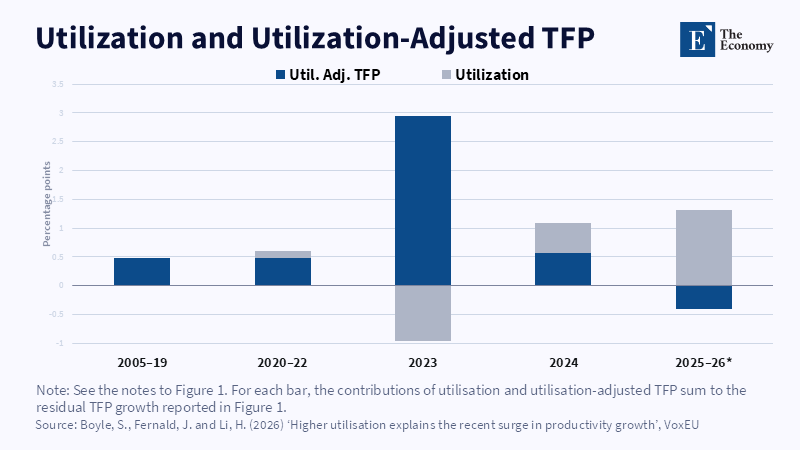
The two accounts are not wholly separate; in practice, they overlap. A company that slashed one-fifth of its workforce and yet held revenues steady is necessarily producing more output given a smaller base. A measure of utilization would register a TFP advance equivalent to exactly this. Pushing workers out of key areas such as administration, middle management and pandemic-related support positions rather than out of those that are core to the production process would be logged as a productivity advance without any change in the effort required to produce final output. Reshuffling costs, then, may be one tangible form of the broad utilization category implied by growth-accounting analysis. It certainly need not be a competing explanation.
AI remains part of the story, although it is less dominant than some narratives suggest. There has been substantial investment in data centers, chips and AI infrastructure. This has probably increased demand across the economy. According to labor trackers, thousands of jobs were attributed specifically to AI in 2026 alone, notably customer support, routine content editing and repetitive coding tasks. Some of this reflects genuine automation. Some firms may also be attributing efficiency gains to AI that arose from downsizing, sales-force restructuring and the correction of overhiring. Company surveys still show only modest realized gains from AI, even as expectations for 2026 remain high. The data through early 2026 do not yet show AI driving the aggregate productivity surge.
Why the Verdict Is Still Open
No single explanation can yet command sufficient confidence. Utilization, the correction for overhiring, the return to office-based work and AI-driven demand all point in the same direction at the same time. This makes the channels harder to distinguish in national accounts data. Productivity data are subject to a large margin of error. They may be revised. They cannot distinguish a firm that has grown more productive in the conventional sense from a firm that has simply removed hard-to-measure roles. Attributing the entire surge to one force requires more confidence than the numbers allow.
The stakes remain high whatever mechanism dominates. For monetary policymakers, an otherwise temporary, cost-cutting and utilization-led productivity improvement cannot persist once excess labor has been eliminated and utilization falls back. It should not, however, be interpreted as a lasting acceleration in the economy's non-inflationary speed limit. For investors, an uptrend in revenue per employee can seem like a change for the better when it is in fact a one-off headcount adjustment that has mostly played out, especially at firms like Meta and Amazon that front-loaded their headcount reductions years ago.
For management teams still cutting pandemic-era staff numbers, the true story behind recent results is not that clever new tools made teams more productive, but that their teams were oversized for the work and markets are now pricing the correction rather than innovation. That adjustment has obviously been real. The facts about employment, mass layoffs and office occupancy support the view that employers created more capacity than was necessary for a stable, remote-first world that ultimately did not materialize. Whether that adjustment entirely accounts for the productivity boom or whether it is merely one of several possible explanations is genuinely an open question. Good analysis would be honest about that fact and not simply opt for the cleanest headline. Any responsible policymaker, forecaster or corporate director ought to treat the recent numbers as a provisional conclusion, with the story still being written, rather than as proof that either overhiring or AI has settled the argument. The final verdict will come from the next few quarters of data, not from the last two years of headlines.
The views expressed in this article are those of the author(s) and do not necessarily reflect the official position of The Economy or its affiliates.
References
Basu, S., Fernald, J.G. and Kimball, M.S. (2006) ‘Are technology improvements contractionary?’, American Economic Review, 96(5), pp. 1418–1448.
Boyle, S., Fernald, J. and Li, H. (2026) ‘Higher utilisation explains the recent surge in productivity growth’, VoxEU, 16 July. Paris and London: Centre for Economic Policy Research.
Challenger, Gray & Christmas, Inc. (2026a) 2025 Year-End Challenger Report: Highest Q4 Layoffs Since 2008; Lowest YTD Hiring Since 2010. Chicago, IL: Challenger, Gray & Christmas.
Challenger, Gray & Christmas, Inc. (2026b) ‘Challenger Report: March cuts rise 25% from February, AI leads reasons’, March. Chicago, IL: Challenger, Gray & Christmas.
Duffy, C. (2023) ‘How Big Tech’s pandemic bubble burst’, CNN Business, 22 January.
Fernald, J.G. (2014) ‘A quarterly, utilization-adjusted series on total factor productivity’, Federal Reserve Bank of San Francisco Working Paper, No. 2012-19. San Francisco, CA: Federal Reserve Bank of San Francisco.
Layoffs.fyi (2024) Tech Layoff Tracker: 2023. San Francisco, CA: Layoffs.fyi.
Meta Platforms, Inc. (2024) Annual Report 2023. Menlo Park, CA: Meta Platforms, Inc.
Meta Platforms, Inc. (2026) Annual Report 2025. Menlo Park, CA: Meta Platforms, Inc.
National Association of Convenience Stores (2026) ‘WSJ: Companies cut jobs, reversing pandemic hiring boom’, NACS Daily News, 30 January.
Putzier, K. and Cutter, C. (2026) ‘U.S. companies are still slashing jobs to reverse pandemic hiring boom’, The Wall Street Journal, 29 January.
Rogelberg, S. (2025) ‘For the first time since COVID, more than half of Fortune 100 desk workers are mandated to fully return to work, report finds’, Fortune, 18 July.
U.S. Bureau of Labor Statistics (2022) Job Openings and Labor Turnover Survey: March 2022. Washington, DC: U.S. Department of Labor.
U.S. Bureau of Labor Statistics (2026a) Job Openings and Labor Turnover Survey: December 2025. Washington, DC: U.S. Department of Labor.
U.S. Bureau of Labor Statistics (2026b) The Employment Situation: March 2026. Washington, DC: U.S. Department of Labor.
Yotzov, I., Barrero, J.M., Bloom, N., Bunn, P., Davis, S.J., Foster, K.M., Jalca, A., Meyer, B.H., Mizen, P., Navarrete, M.A., Smietanka, P., Thwaites, G. and Wang, B.Z. (2026) ‘Firm data on AI’, NBER Working Paper, No. 34836. Cambridge, MA: National Bureau of Economic Research.
Working across research, policy, and data-driven analysis, the Editorial Board ensures that published pieces reflect a consistent institutional perspective grounded in quantitative reasoning and long-term structural assessment.