The Slow Portfolio Adjustment to Equity Premium Changes

Working across research, policy, and data-driven analysis, the Editorial Board ensures that published pieces reflect a consistent institutional perspective grounded in quantitative reasoning and long-term structural assessment.
Authored On
Modified
Norwegian data show portfolio adjustment takes years, not months
Slow adjustment turns dangerous when equity premium shifts are abrupt
Policy and portfolio implications diverge based on shock type

When Norway abolished the preferential tax treatment of shares under the wealth tax in 1998, the after-tax equity premium of the affected households fell by about 30 basis points. Within two years, these households reduced the share of shares in their financial wealth by only 0.5 percentage points compared to the control group, which corresponds to less than a quarter of the final adjustment. It took five to six years for the reduction to reach two percentage points. This finding, which emerged from the study by Andreas Fagereng, Luigi Guiso and Marius Ring on administrative data of the Norwegian population, refutes a basic assumption of portfolio models: that investors move funds to the optimal point in less than a year.
Norwegian Wealth Taxation as a Natural Experiment
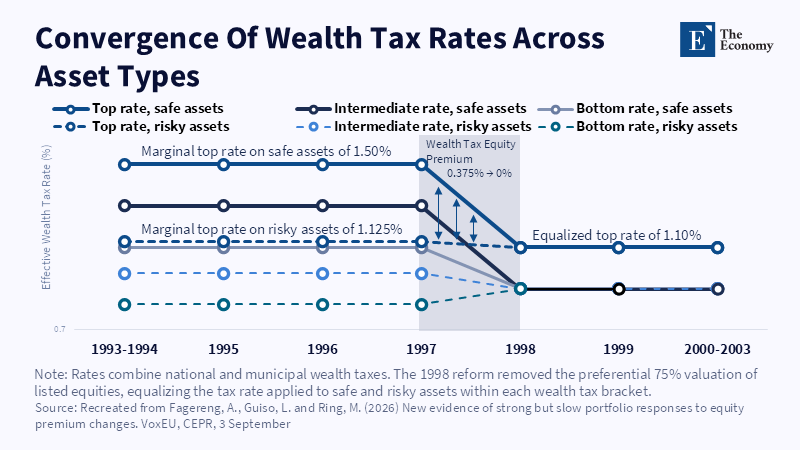
The difficulty in measuring investors' sensitivity to changes in the equity premium stems mainly from the fact that expected returns are not immediately observed and that their changes usually affect all investors at the same time, without a control group. Norwegian wealth taxation solved both problems in an almost experimental way. Since 1992, listed shares have been valued, for wealth tax purposes, at 75 percent of their market value, while deposits have been valued at their full value. The result was an artificial increase in the after-tax equity premium for those subject to the tax, with the size of the increase depending on the marginal wealth tax rate of each household. Households below the tax threshold remained unaffected, forming a natural control group.
The repeal of the measure in 1998 reversed the relationship, giving researchers two separate episodes of changing the equity premium in opposite directions, without the taxation of capital income having changed. Wealth taxation remained a purely design tool, without touching the pre-tax returns of assets. This clarity in design is what allows the observed change in portfolio behavior to be attributed exclusively to the tax incentive, without interfering with other macroeconomic factors that would affect both groups at the same time.
How Slowly Investors Adapt
The short-term response of households was, as previous literature based on survey data showed, moderate. However, the long-term picture differs significantly. The overall adjustment turned out to be substantially larger than the short-term response and when interpreted through a standard portfolio model, it yielded relative risk aversion ratios between 2 and 3, values that are within the usual range used by academic models. Analysis limited to the first or second year after the reform would have led to the wrong conclusion that investors were low in sensitivity, when in fact most of the adjustment had simply not yet occurred.
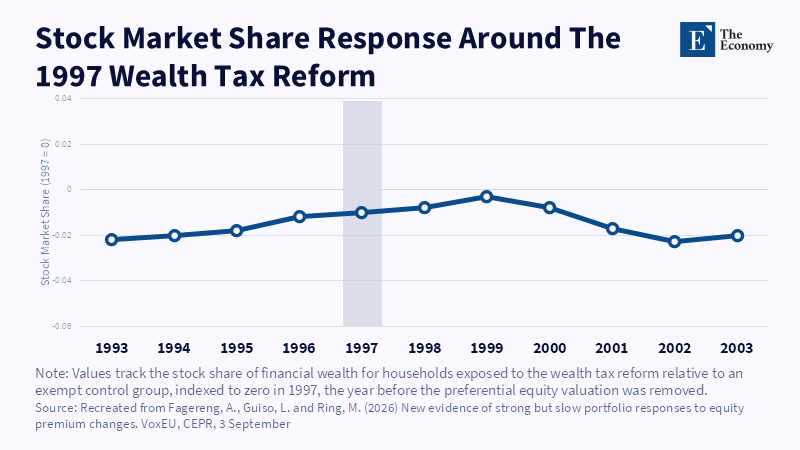
The asymmetry of the response offers an additional element. When the incentive was introduced in 1992, the increase in equity participation caused a significant entry of new investors into the market. But when the incentive was abolished in 1998, these new investors largely remained in the market rather than exiting. The finding suggests an entry cost, estimated at $800, separate from a smaller recurring cost of participation of around $90, which is not easily reversed by a reverse change in the tax incentive. Participation in the stock market appears to function as an inertial decision of its own, separate from the decision on the size of the position.
What Explains Inertia in Portfolio Adjustment
In a frictionless model, the adjustment should be instantaneous once the expected yield changes. The study estimates that for the average household the gain from immediate full adjustment, rather than its gradual spread over five years, is extremely small for the average household. Such a small amount means that even minimal costs of attention, gathering information, or processing transactions are enough to produce a significant slowness in adaptation, without having to assume major hurdles or rational restraint.
The speed of adaptation is not uniform among households. Those that, based on observable characteristics, face lower adjustment costs respond significantly faster and these households hold a disproportionately large share of the total equity market. Aggregate asset demand therefore depends not only on the average investor's adjustment speed but also on which specific investors own the shares. The authors do not identify the exact source of friction, leaving open whether it is periodic attention, information processing costs, procrastination, or a simple preference for gradual adjustment through new savings rather than active trading of existing positions.
When Slow Adaptation Becomes Dangerous
This interpretation does not mean that slowness always works as a prudent strategy. Bruno Luiz Buriozzi, writing for the CFA Institute Research and Policy Center, describes two episodes where the slow reaction came at a high cost. In March 2020 the VIX index reached 82.69 points, surpassing the peak of the 2008 crisis; the S&P 500 lost a third of its value between February 20 and March 23 and the yield on the ten-year US Treasury fell below 0.71 percent. The correlations of stocks and bonds reversed within a few weeks as liquidity disappeared. In 2022, the rupture had a completely different cause. Inflation, not liquidity, dominated, stocks and bonds fell together for fourteen consecutive months and a typical 60/40 portfolio recorded an annual loss of 16.7 percent, its worst calendar-year performance in modern history.
In such conditions, the structural slowness documented by the Norwegian study ceases to be a neutral behavioral observation and becomes a source of risk. An investor who takes five years to complete an adjustment to a fixed, predictable tax incentive does not have that time when the change in risk occurs within weeks. The difference lies in the nature of the stimulus. A change in the tax rate is not immediately observed, does not change pre-tax yields and does not require an urgent response, so the gradual approach to it is a rational consequence of the low cost of inaction. A liquidity crisis or a sharp change in the correlation of stocks and bonds does not leave the same margin.
It is also worth noting that the Norwegian case is surrounded by institutional factors that are not easily replicated elsewhere, such as the wealth tax threshold that created a net audit team, the stability of the tax regime beyond the two reforms and access to administrative data of the entire population. The comparison with cases of financial crisis should be done with caution, as the incentive framework and the speed of information transmission differ substantially.
Implications for Asset Prices and Policy
The inelasticity of demand for equities in the short term, as documented in the Norwegian study, is linked to a wider literature that argues that small shifts in demand can move prices significantly, precisely because capital does not immediately flow towards assets with a higher expected return. Household-level sluggishness offers a microeconomic explanation for the macroeconomic observation that markets often appear less elastic than classical models predict.
For policymakers seeking to redirect household savings towards specific asset classes, this finding is of immediate relevance. A weak short-term response to a tax stimulus does not prove that the stimulus has failed. An assessment based on data one or two years after the introduction of a measure risks seriously underestimating its long-term impact, with the practical consequence that policies that are deemed prematurely ineffective may simply not yet have had time to work.
For portfolio managers and institutional investors, the lesson is moving in the opposite direction depending on the type of change they are facing. In the face of slow, predictable shifts in incentives, such as a gradual tax reform or a slow change in interest rates, late adjustment does not entail significant opportunity costs and may simply reflect rational transaction cost management. In the face of abrupt changes in risk regime, where the correlation between asset classes can change sign within weeks, the same inactivity becomes a source of severe loss. The question that remains open is how a portfolio could differentiate in advance between these two cases, given that the nature of the stimulus is not always obvious at the time it manifests.
The Norwegian study shows that investors are not as inactive as short-term metrics suggest, they just need time. The large difference between the short-term and long-term response, about four times, shows how misleading an assessment limited to the first two years after a change in stimulus can be. But the same slowness that reconciles household behavior with reasonable levels of risk aversion in a stable tax environment becomes risky when the stimulus is not gradual but abrupt. The VIX ratio at 82.69 points and the 16.7 percent loss of a typical 60/40 portfolio in a calendar year are a reminder that the speed of adjustment is not a fixed characteristic of an investor, but a function of the speed at which the high risk he is called upon to manage changes.
This article reflects the analytical judgment of The Economy Editorial Board and does not constitute policy advice or the official position of any affiliated institution.
References
Buriozzi, B.L. (2026) 'Why Static Portfolios Fail When Risk Regimes Change', CFA Institute Research and Policy Center, Enterprising Investor Blog, 20 February.
Fagereng, A., Guiso, L. and Ring, M.A.K. (2026) 'How Much and How Fast Do Investors Respond to Equity Premium Changes? Evidence from Wealth Taxation', NBER Working Paper No. 35262, May.
Fagereng, A., Guiso, L. and Ring, M. (2026) 'New Evidence of Strong but Slow Portfolio Responses to Equity Premium Changes', VoxEU, CEPR, 3 September.
Working across research, policy, and data-driven analysis, the Editorial Board ensures that published pieces reflect a consistent institutional perspective grounded in quantitative reasoning and long-term structural assessment.