[Longevity and Inequality] The Dynamic Active Ageing Index and Lifelong Gaps by Education, Gender and Country
Authored On
Modified
A preliminary joint index tracks active ageing person by person
Italy, older women and less-educated groups score lower
Ageing inequalities reflect lifelong disadvantage, not age alone
Conference context / Conference recording
This article was adapted by The Economy Review from “Active and Healthy Ageing,” a conference paper supplied by Agar Brugiavini of Ca’ Foscari University of Venice and presented at the Inequalities in Longevity conference at Fondazione Giorgio Cini in Venice on 3–4 July 2026. The presentation drew on preliminary work described in the unpublished manuscript “A dynamic Active Ageing Index,” by Koray Aktas, Agar Brugiavini, Matteo Cazzaro and Ya Gao. This adaptation examines how education, gender, marital status and geography are associated with unequal trajectories of active ageing. The Economy Review is responsible for the editorial adaptation.
Living longer does not necessarily mean living better. Across Europe, people of the same age experience markedly different levels of health, financial security, independence and social participation. These differences reflect inequalities accumulated throughout life, including education, employment and family circumstances. The preliminary research presented by Professor Agar Brugiavini proposes a way to measure these differences and trace how they evolve as people grow older.
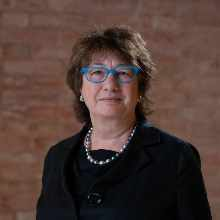
Europe is ageing at a rate that is reshaping the labour market, pension systems, healthcare and long-term care, but the number of years added to life says little about how those years are spent. Professor Agar Brugiavini of the Ca’ Foscari University of Venice raises exactly this issue in her paper on active and healthy ageing, which she presented at the conference on inequalities in longevity at the Fondazione Giorgio Cini in Venice in July 2026. She is interested in whether extra years of life are accompanied by good health, adequate resources, autonomy and the possibility of social participation, and who really has access to them, a question that the Dynamic Active Ageing Index described in her presentation is designed to measure.
Active ageing, as described by the World Health Organization and the OECD, is about the opportunities and capabilities that enable older people to stay healthy, independent, socially connected and financially secure. These opportunities are not shared equally. Education, career path, income, marital status and place of residence leave traces that often deepen with age, and in Italy data on frailty show earlier and faster deterioration in women, those living alone and those living in the South and on the islands.
The Dynamic Active Ageing Index Tracks Individuals over Time
Existing Active Ageing Indices have been useful for comparisons between countries, but they are mainly based on aggregated figures. The national average hides large differences between people living under the same institutional framework, and a static score per country cannot show what happens to a person’s well-being when they retire, are widowed or go through a serious health problem, so studying uneven ageing as a process requires a measure that follows the same person over time.
The Dynamic Active Ageing Index, developed in the preliminary collaborative research described by Brugiavini, is constructed with data from the Survey of Health, Ageing and Retirement in Europe, known as SHARE. The analysis draws on waves 4 to 9 of the survey, from 2010/11 to 2022, and covers respondents aged around 50 to 90 in 17 European countries. The index combines nine domains: subjective well-being, physical health along with cognitive function and mental health, abilities, social networks, participation in society, lifelong learning, housing, employment and financial resources.
Within each domain, principal component analysis, known as PCA, is applied, and in this preliminary stage the domains are given neutral weights to avoid strong value assumptions about which one counts the most. The index records observed results and leaves legislative provisions and policy tools out of the calculation. Brugiavini clarifies that the index is not a social welfare function and does not judge how older people should live; it is a common statistical measure of differences between people, countries, generations and time periods.
Italy Lags Behind and Women Lose More Ground after 70
The first results, which Brugiavini describes as descriptive and preliminary, show that active ageing decreases with age in all groups, but with differences in both the level and the slope of the curves. Men in the European sample have the highest values in most of the age range, while European women start close to them but fall faster at older ages. Italy records lower values from the age of 50 onwards, with the gender gap already visible at relatively young ages, and after about the age of 70 the decline in Italian women becomes particularly pronounced, steeper than that of Italian men.
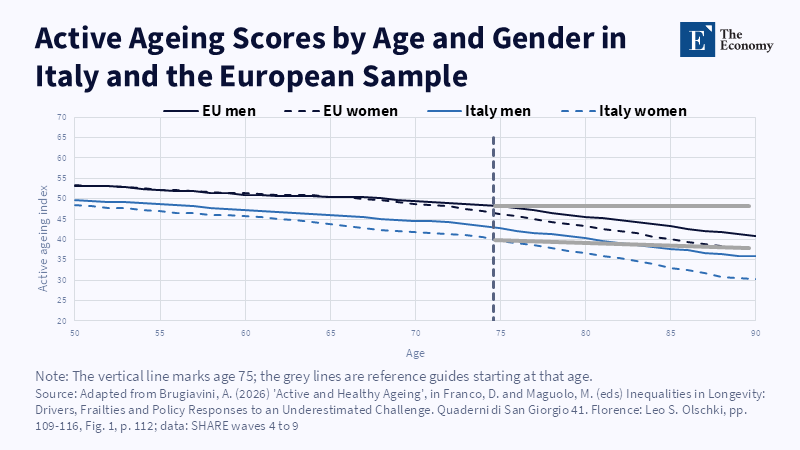
Brugiavini herself cautions that the picture does not attribute deterioration solely to age. Age curves incorporate biological ageing along with differences in education, career paths, income, family circumstances and birth generation.
Education Separates Active Ageing Scores from Age 50
When the paths are divided by education and gender, a clear and stable hierarchy appears. Respondents with post-secondary education generally record the highest Active Ageing Index scores, followed by those with high-school education, while those with less than high-school education consistently score lowest. The gaps are already large at 50 and remain visible throughout later life. Brugiavini reads the pattern through the life cycle, since education is linked to the profession, earnings, knowledge of health issues, cognitive reserve, social participation and the ability to adapt to technological and institutional changes.
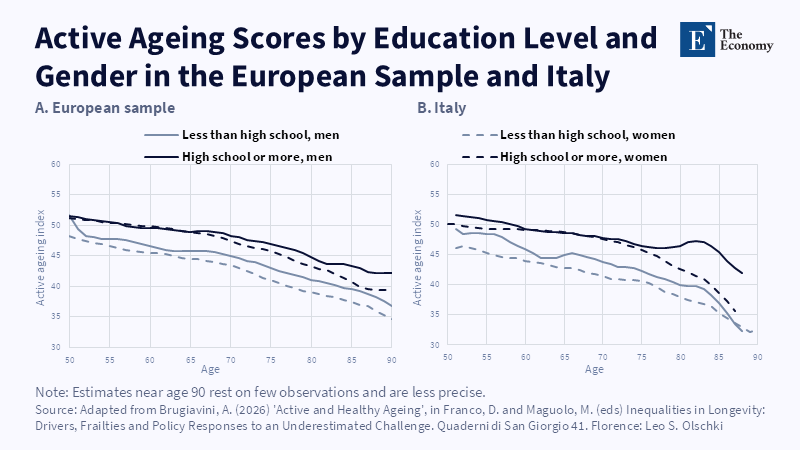
Gender differences vary between educational groups and countries. In the European sample, men and women with similar education follow close paths at younger ages, although women’s curves tend to fall more sharply later. In Italy, women generally have lower values than men in the same educational category, and the gap widens at advanced ages, mainly among those with low education.
Preliminary multivariate estimates from the collaborative research, presented by Brugiavini at the conference, give these differences a magnitude. Compared to those who did not complete high school, a high school diploma is associated with an advantage of about five points on the index, and post-secondary education with an advantage of eight to ten points. Widowhood, never having married, divorce or a marriage without cohabitation are associated with lower values than cohabitation with a spouse, even after taking into account age, gender and the survey wave. These are associations, not causal estimates.
Ageing Policy Needs More than Chronological Age
According to Brugiavini, active ageing decreases with age, but the decline is far from uniform, and the patterns she captures support the view that ageing is shaped by cumulative socioeconomic conditions rather than just by the passing of years. For public policy, the findings suggest a practical point. Policies relying exclusively on chronological age or average life expectancy may overlook substantial differences in older people’s circumstances. Brugiavini’s index offers a framework for identifying such inequalities and examining how they develop over time.
As a monitoring tool, the index can identify groups whose trajectories are deteriorating earlier and show whether gaps are converging or widening. She insists on careful reading: the weights from principal component analysis reflect statistical covariance rather than societal preferences, while participant withdrawal from the survey, selective mortality and changes in measurement from wave to wave may influence trends over time.
Table 1. Preliminary Findings of the Dynamic Active Ageing Index
| Dimension | Preliminary finding |
|---|---|
| Geographical variability | Age profiles differ across settings; the Italian sample shows lower index scores than the broader European sample from about age 50 |
| Gender | Women’s scores decline more sharply at older ages, particularly among Italian women after about age 70 |
| Education | Compared with less than high-school education, high-school attainment is associated with about +5 index points and post-secondary education with about +8 to +10 points |
| Marital status | Not living with a spouse is associated with lower index scores |
As Brugiavini explains, the contribution of the index is specific: a common and transparent measure of how opportunities and outcomes differ as Europeans age, without defining how older people should live. Early findings from 17 countries already show that two people of the same age may be at very different points on the curve, with a gap of eight to ten points between those who stopped before high school and those who continued after it. How much of this distance is due to education itself and how much to what accompanies it throughout life, the analysis has not yet singled out.
Publication note
This article is an editorial adaptation of Professor Agar Brugiavini’s conference paper “Active and Healthy Ageing.” The research presented draws on preliminary, unpublished joint work by Koray Aktas, Agar Brugiavini, Matteo Cazzaro and Ya Gao, “A dynamic Active Ageing Index.” The Economy Review is responsible for the editorial adaptation.
References
Aktas, K., Brugiavini, A., Cazzaro, M. and Gao, Y. (unpublished manuscript) ‘A dynamic Active Ageing Index’.
Börsch-Supan, A., Brandt, M., Hunkler, C., Kneip, T., Korbmacher, J., Malter, F., Schaan, B., Stuck, S. and Zuber, S. (2013) ‘Data resource profile: the Survey of Health, Ageing and Retirement in Europe (SHARE)’, International Journal of Epidemiology, 42(4), pp. 992-1001.
Brugiavini, A. (2026) ‘Active and healthy ageing’, in Franco, D. and Maguolo, M. (eds) Inequalities in Longevity: Drivers, Frailties and Policy Responses to an Underestimated Challenge. Quaderni di San Giorgio 41. Florence: Leo S. Olschki, pp. 109-116.
Steinmayr, D., Weichselbaumer, D. and Winter-Ebmer, R. (2020) ‘Gender differences in active ageing: findings from a new individual-level index for European countries’, Social Indicators Research, 151(2), pp. 691-721.
UNECE and European Commission (2019) 2018 Active Ageing Index: Analytical Report. Geneva: United Nations Economic Commission for Europe.
World Health Organization (2015) World Report on Ageing and Health. Geneva: World Health Organization.