Tariff Pass-Through and the Energy Shock: Why the Pump Has Weighed on Inflation More Than Customs

Working across research, policy, and data-driven analysis, the Editorial Board ensures that published pieces reflect a consistent institutional perspective grounded in quantitative reasoning and long-term structural assessment.
Authored On
Modified
Tariffs added far less to inflation than feared
Distribution margins halved what tariffs did to shelf prices
Energy reached services; tariff effects stayed within goods

At their highest point, in February 2026, the Trump administration’s tariffs added 2.9 percentage points to the annual rate of rise in prices in 67 categories of consumer goods other than oil, according to the calculations of researchers at the Federal Reserve Bank of New York. The number seems large only when read in isolation. The president of the same bank estimated in January that out of an overall inflation close to 2.75%, tariffs explained about half a point, while in August the US Bureau of Labor Statistics recorded a year-on-year rise of 16.3% in the energy index and 27.4% in gasoline, after the war with Iran had disrupted crude supply. Tariff pass-through to consumer prices thus remained noticeably below the scenarios circulating in 2025, at the same time that energy raised the general index to 3.4% with core inflation at 2.4%. The distance between the two shocks has to do with the path each takes through the value chain, an issue that the headlines about “how much” left almost untouched.
The Tariffs Paid Fell Well Short of Those Announced
The spring 2025 scenarios were based on rates that never stayed in place for long. In April of that year, additional tariffs on Chinese products reached 145%, a level that the US Treasury Department called in practice an embargo and on May 23 the Yale University Budget Lab estimated an average effective tariff rate of 21.9%, the highest since 1909, with a short-term rise in the price level of 2.2% and a loss of about $3,600 per household. In October, Citigroup predicted that the share of the burden borne by American consumers would rise from between 30% and 40% to about 60% within a few months, as inventories built up before the tariffs ran out. The logic was simple: what businesses had absorbed would gradually pass to households.
The policy that was finally implemented was more lenient at almost every stage. The Geneva agreement in May 2025 lowered the additional tariff on China from 145% to 30%, the truce was extended again and again, with the most recent extension reaching until January 10, 2027 and in early 2026 a decision of the US Supreme Court ended the tariffs imposed based on emergency powers, after which the administration replaced them with a lower 10% surcharge. Already on November 17, 2025, the same Budget Lab had revised the effective rate to 16.8% and the rise in the price level to 1.2%, noting that without the emergency tariffs the effect would have been limited to 0.6%. Businesses also had time to adjust, switching suppliers and staggering increases rather than putting them on price tags at once. The New York Fed observed in January that no major bottlenecks in supply chains had emerged, wages were rising at rates consistent with low inflation and expectations remained anchored, conditions under which tariff pass-through would hardly turn into a generalized wave of price increases. Less clear was exactly how the shock moved through prices.
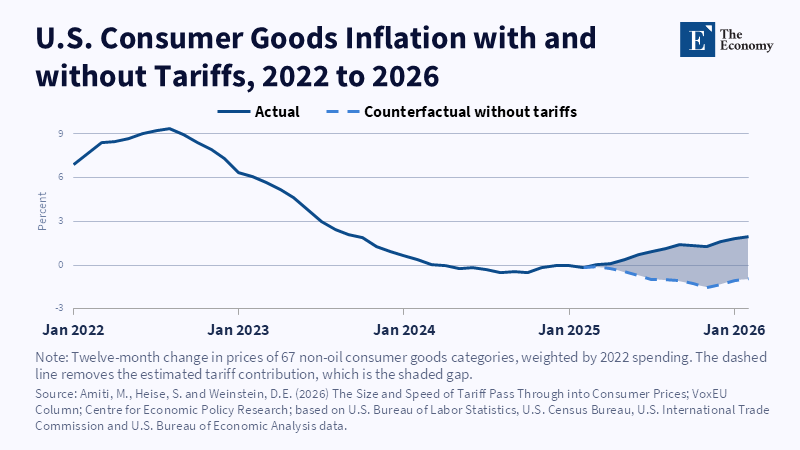
How Tariff Pass-Through Reaches the Shelf
At the border, the picture is almost mechanical. New York Fed researchers find that foreign exporters cut their prices very little, so about 90% of 2025 tariffs passed into import prices, almost one for one from the first month and even after taking into account the depreciation of the dollar. The same split was recorded in the trade war of 2018 and 2019, when import prices almost completely absorbed tariffs while store prices moved much more moderately. The effect is diluted further down the chain. Transportation, wholesale and retail account for about half of the final price of a good and none of these margins are taxed at customs. A $100 product with a $50 value at the border and a $50 distribution cost becomes more expensive by 5% when the tariff raises the import price by 10% and the researchers’ estimate of 5.6% at retail for every 10% increase in import and producer prices is very close to this simple example.
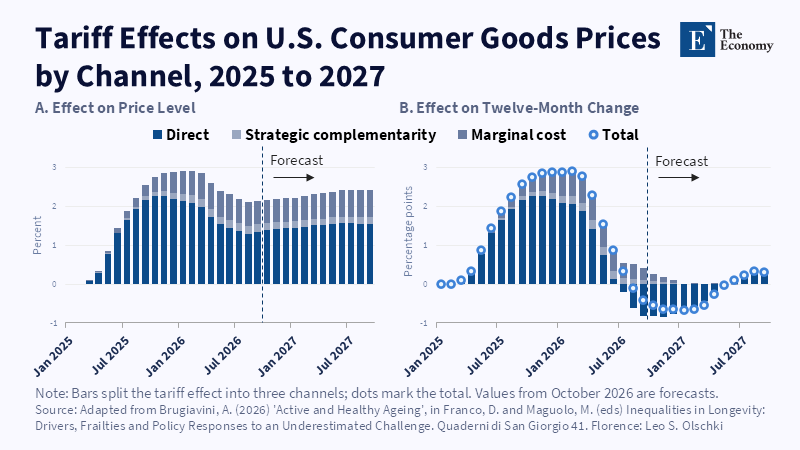
The second route involves products that never pass through customs as finished goods. A tariff on steel makes car manufacturing more expensive within the U.S. and when the imported competing product costs more, the domestic producer has less reason to hold back its own profit margin. The two channels are found in the data, with the cost channel being the stronger, but they operate slowly, since producer prices rise only slightly in the first six months after a tariff and roughly double their response over the following six, while about half of the direct effect on imported goods is in place within three months and all of it within six. Overall, a general tariff of 10% on all imports would raise the prices of consumer goods by 2.6% after twelve months, i.e. about a quarter of the tariff, with two-thirds coming from imports and one-third from domestically produced goods. By February 2026, the indirect part of tariff pass-through had reached the point of explaining about 30% of the total effect on the price level, a percentage that continues to rise as domestic producers belatedly adjust their price lists.
Energy Costs Run Through Every Link of the Value Chain
A tariff is a tax on a list of customs tariff codes, while energy does not have a list. The factory that melts aluminum, the truck that transports the product to the warehouse, the warehouse that is cooled, the store that is lit and heated and the office building where the company’s accounting department works all pay an electricity or fuel bill and each link can pass the cost on to the next. The August data show this route quite clearly. In addition to the 27.4% rise in gasoline and 52% in heating oil, air tickets, which typically belong to the core index, were 23.4% more expensive than a year earlier, while gasoline alone accounted for more than a third of the monthly 0.4% increase in the general index. Electricity moved more slowly, with an annual increase of 3.8%, but it is an input that no commercial or industrial site does without.
Research on so-called second-round effects puts numbers on this picture. Economists on the Fed’s Board of Governors, looking at 27 advanced economies, calculated that a 10% increase in the price of Brent brings up the energy index by 2.3% within two quarters, food prices by 0.3% and the core index by 0.1%, with the overall effect on the general index approaching 0.4% and the indirect effects accumulating over about eight quarters. In Canada, the UK and the eurozone, second-round effects added an average of half a point to annual inflation from the fourth quarter of 2022 onwards. A study by the London School of Economics’ Centre for Macroeconomics in 38 OECD countries concluded that core inflation rises gradually for about 14 months after an energy shock and that services react almost as much as goods, a finding that is in line with data from the UK Office for National Statistics, where the energy intensity of services is 2% compared to 1.4% for non-energy goods, i.e. a sector usually considered shielded from oil prices uses proportionately more energy than shelves exposed to tariffs.
Tariffs Stay in Goods While Energy Reaches Services
The comparison between tariff pass-through and energy pass-through is mainly a question of breadth. The tariff hits goods that cross borders and, through inputs, a part of domestic manufacturing, while services, which make up about two-thirds of the consumer basket, are almost left out. It also raises the price level once. Once the increase is incorporated, the annual pace fades: the contribution of tariffs to the inflation of goods is estimated to have fallen from 2.9 points in February to around zero in August 2026 and to turn negative as the large increases in 2025 come out of the comparison, while prices remain around 2% above the no-tariff scenario. In the August index, core goods, excluding food and energy, were only 0.7% more expensive year-on-year, while non-energy services were running at 3.0%. Energy has a direct weight of about 7.3% in the basket and returns indirectly through the cost of each service and expectations, with no effective date like a tariff decree.
The objection most often heard is that the tariff is not as narrow as it seems. Steel, aluminum and parts make their way into thousands of domestic products and the New York Fed’s estimates keep factors that affect the entire economy, exchange rate, wages, demand and monetary policy constant, so the real effect could be greater. The data do not support this reading in its strong form. The indirect channel accounts for about a third of the total effect and stays within tradable goods, while the New York Fed found no traces of broader pressures on wages or expectations, at the same time that energy had already reached airports. The energy side isn’t entirely clean either, as research originally published by the Dallas Fed found that in the U.S. gasoline shocks had a modest effect on the headline index and little on the core index, with pass-through being strongest in the eurozone and the dollar’s depreciation over the same period also pushed up import prices in a way that neither channel captures cleanly.
The Fed Faces Two Clocks and Importers Lose Their Cushion
For monetary policy, the difference between tariff pass-through and energy shock translates into a different tracking timeline. The tariff has a known date and predictable trajectory, so a central bank can calculate when its effect will wear off and with tariffs on Canadian products from August 2026 and the increase in Canadian cars, trucks and parts announced for January 2027, the contribution to goods inflation is expected to turn slightly positive by mid-2027. The energy shock requires monitoring the core index for at least a year after the peak, with the awareness that part of the rise in services will be delayed energy costs rather than domestic overheating. For importers and retailers the conclusion is less comfortable. The distribution margin that halved the tariffs includes truck fuel, warehouse cooling and store electricity, so when the two shocks coincide, the cushion that protected the consumer in 2025 is thinning.
The figure of 2.9 points will continue to be used as proof that tariffs cost and indeed did, since they left goods about 2% more expensive than they would otherwise be. But the same figure concerns a basket of goods other than oil, corresponds to about half a point in total inflation and follows a trajectory that can be plotted months in advance, on the calendar of trade decisions. For energy, there is no such calendar. In August 2026, the month in which the contribution of tariffs to inflation of goods was estimated to have fallen close to zero, gasoline alone accounted for more than a third of the monthly rise in the general index and airline tickets became more expensive by 2.7% within a month. Whether the same traces will appear more widely in services will start to show in the September data, which the Bureau of Labor Statistics releases on October 14.
The views expressed in this article are those of the author(s) and do not necessarily reflect the official position of The Economy or its affiliates.
References
Alp, H., Klepacz, M. and Saxena, A. (2023) ‘Second-round effects of oil prices on inflation in the advanced foreign economies’, FEDS Notes. Washington, DC: Board of Governors of the Federal Reserve System, 15 December.
Amiti, M., Flanagan, C., Heise, S. and Weinstein, D.E. (2026) ‘Who is paying for the 2025 U.S. tariffs?’, Liberty Street Economics. New York: Federal Reserve Bank of New York, 12 February.
Amiti, M., Heise, S. and Weinstein, D.E. (2026a) The anatomy of tariff pass-through into consumer prices. Federal Reserve Bank of New York Staff Report No. 1201. New York: Federal Reserve Bank of New York.
Amiti, M., Heise, S. and Weinstein, D.E. (2026b) ‘The size and speed of tariff pass through into consumer prices’, VoxEU. London: Centre for Economic Policy Research, 12 October.
Bureau of Labor Statistics (2026) Consumer Price Index: August 2026. News Release USDL-26-1496. Washington, DC: U.S. Department of Labor, 11 September.
Cavallo, A., Gopinath, G., Neiman, B. and Tang, J. (2021) ‘Tariff pass-through at the border and at the store: evidence from US trade policy’, American Economic Review: Insights, 3(1), pp. 19-34.
Delaney, S. (2026) ‘Trump’s tariff inflation shock proves limited as energy and semiconductor costs increase the burden on U.S. households’, The Economy, 12 October.
Kilian, L. and Zhou, X. (2023) ‘A broader perspective on the inflationary effects of energy price shocks’, Energy Economics, 125, 106893.
The Budget Lab at Yale (2025a) State of U.S. tariffs: May 23, 2025. New Haven, CT: Yale University.
The Budget Lab at Yale (2025b) State of U.S. tariffs: November 17, 2025. New Haven, CT: Yale University.
Vlieghe, G. (2024) Core strength: international evidence on the impact of energy prices on core inflation. CFM Discussion Paper 2024-07. London: Centre for Macroeconomics, London School of Economics.
Williams, J.C. (2026) ‘A few words for the New Year’, speech delivered at the Federal Reserve Bank of New York, 12 January.
Working across research, policy, and data-driven analysis, the Editorial Board ensures that published pieces reflect a consistent institutional perspective grounded in quantitative reasoning and long-term structural assessment.