Supply Disruption Inflation: Why Natural Gas Weighs More Than Rare Earths

Working across research, policy, and data-driven analysis, the Editorial Board ensures that published pieces reflect a consistent institutional perspective grounded in quantitative reasoning and long-term structural assessment.
Authored On
Modified
Fear of future gas shortages drove Europe’s inflation
Energy shocks spread wider than rare earth disruptions
Credible future supply is Europe’s best inflation defence
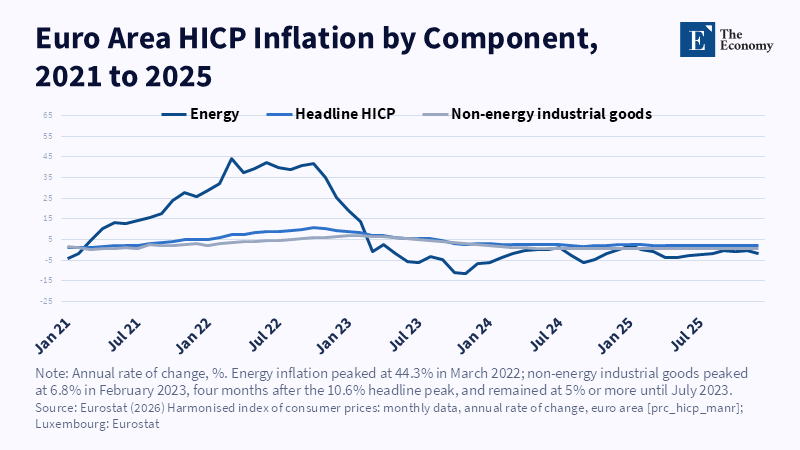
In October 2022, annual inflation in the euro area reached 10.6 percent, the highest level in the history of the single currency and according to Eurostat, 4.44 percentage points of this figure came from energy alone, whose prices were 41.5 percent higher than a year earlier. Production held up better than the unfavorable estimates circulating in the spring of 2022 about the cost of a complete halt to Russian flows, mainly because cargoes of liquefied natural gas from global markets filled much of the gap. An economy that continues to function while its prices soar is not easily explained if gas is treated simply as a missing quantity. Supply disruption inflation follows paths that depend on what exactly is being disrupted, how visible its price is and how difficult it is to replace and the experience of gas after the Russian invasion of Ukraine shows that fear of the coming winter has cost consumers more than the physical shortage itself.
The Gas Price Hides Two Different Supply Shocks
A 10 percent rise in the price of natural gas can mean three very different things to the economy and the price alone does not say which of the three is happening. It can reflect stronger demand, for example a severe winter. It can reflect a real disruption in current flows, such as a failure in a pipeline. It can also reflect a news story that makes the supply of the coming months less certain, without missing a single cubic meter today. Economists at London Business School and the Université Côte d’Azur, in a 2025 research paper, divided these cases by exploiting two sources of change that are difficult to relate to the rest of the economic cycle: temperature deviations from seasonal normal levels, which move demand for heating and unexpected futures movements around events with a clear date, keeping only those that were demonstrably linked to gas supply and not broader macroeconomic news.
Two distinct supply disruptions emerge from this process. Shutdowns and pipeline failures define current flow disruptions, while announcements that change the availability expected in the future, without necessarily touching current deliveries, define security of supply news. For the former, the daily changes in spot prices and next-month contracts were measured, for the latter, contracts with a longer horizon were used. The finding that explains much of what followed is that gas demand reacts to price less than supply, both in the euro area and in the United States. When a disruption hits the supply side, the market is forced to adjust on a steep demand curve, so the price moves strongly even when the quantities that change hands move little, which helps to understand why the 2022 images showed extreme prices and relatively mild changes in consumption volumes.
Fear of Next Winter Drove Supply Disruption Inflation
When the two shocks are normalized to increase the real price of gas by 10 percent at the time they occur, their consequences for consumer prices diverge significantly. A realized disruption brings down industrial production for a short period of time, but its pass-through to the consumer price level is limited to around 1 percent; i.e. a 10 percent increase in the price of gas raises consumer prices by about 0.1 percent. The news that future supply has become less secure leaves industrial production almost untouched, while the pass-through starts at about 2 percent and rises to about 5 percent after a year, corresponding to a 0.5 percent rise in the price level for every 10 percent increase in the price of gas. The strange thing is that news of this type does not reduce the measured supply at the time it is announced and consumption hardly changes, while inventories and financial market volatility rise and stay high, an indication that buyers and traders are hoarding gas preemptively, in the same way that Lutz Kilian and Daniel Murphy showed in 2014 that demand for inventories transfers to current oil prices expectations of a future shortage.
The United States, with domestic production that makes it much less dependent on imports, acts as a useful measure of comparison. In both markets, flow disruptions have little pass-through to consumer prices, with American industrial production virtually unaffected and the European decline short-lived. What sets Europe apart is the large and persistent reaction of consumer prices to news about future availability, consistent with its exposure to global gas markets, where the replacement of Russian quantities with liquefied gas, as recorded by Bank of Italy researchers in 2024, changed the balance of the entire international market.
The path from the price of gas to the shelf goes mainly through the production costs of manufacturing. Energy enters almost every industrial sector as an input and when it becomes more expensive, the cost of intermediate goods rises and is passed on along the input and output network to customers further down the chain. Researchers at the Federal Reserve Bank of New York found in 2022 that supply factors exert a disproportionate effect on the producer price index, which then passes to consumer prices of goods but not services, while a study by the same institution on pandemic inflation showed that energy disruptions had a particularly large impact because businesses did not have a technical way to substitute energy in their processes. This chain explains why a shock that began with Russian pipeline deliveries resulted in more expensive industrial products across the continent, with a delay of months and with an intensity that the very volume of gas lost would not have foreseen.
Germany Paid for Adjustment with Production and Investment
The euro area’s overall resilience masks an adjustment that was expensive where gas mattered and was not easily replaced. Germany was at the centre of the 2022 debate on whether substitution and reallocation could contain the costs of a halt in Russian imports and before the crisis its spending on gas imports accounted for around 0.8 percent of gross national expenditure, a measure that includes household consumption, investment and public spending, compared to 0.5 percent for the euro area as a whole. Reduced gas use alone is not enough to distinguish a successful substitution from an economic contraction, as consumption can fall because businesses switched fuel or became more efficient without losing production, or because they simply produced and spent less.
To distinguish the two paths, the analysis combined flow disruptions and security of supply news into a single shock and compared Germany’s reactions with those of the euro area. In Germany, the shock reduces gas use, gross national expenditure and investment and leaves industrial production persistently below its baseline, while in the euro area the corresponding reactions are milder and short-lived, with private consumption also falling, albeit with less statistical accuracy. More expensive energy costs erode purchasing power, weaken aggregate demand and prolong the decline in activity. Fuel change also carries an environmental price that is rarely included in energy security assessments, because the realized flow interruptions, by raising the price of gas, push electricity production towards coal and oil and increase emissions in the short term, while the security-of-supply news, with the more persistent price increases it causes, is associated with lower emissions over longer horizons, which means that the shock with the heaviest inflationary footprint is at the same time the one that seems to push the economy towards cleaner sources, without it being yet clear how much of this shift will last when prices fall.
Eight Types of Supply Shocks Leave Very Different Inflation Footprints
The history of gas becomes more understandable when placed alongside other types of supply disruptions. A review of 88 research papers published by the Brookings Institution in November 2025 identified eight distinct types of disruptions, six major transmission channels and seven amplification mechanisms, with global supply chain disruptions occurring most frequently in the literature, in 27 cases, followed by productivity disruptions with 21 and pandemic disruptions with 17. The channel of the production function, i.e. the plain rise in firms’ production costs, carries all eight types, but the final effect on inflation is judged by the amplifiers it encounters on its way and the review concludes that inflation becomes more severe and more persistent when many amplifiers are operating at the same time, for example when a commodity price shock hits sectors with rigid production at the same time that inflationary expectations are not firmly anchored.
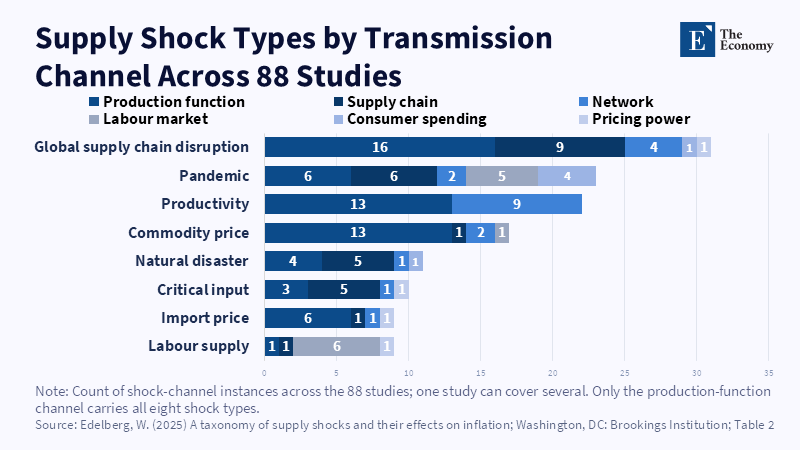
Energy and rare earths end up in different positions on this map. Shocks in commodity prices touch almost all sectors at the same time and concern prices that consumers see every day and Paul Beaudry, Chenyu Hou and Franck Portier showed in 2025 that price increases in categories such as fuel and food have a disproportionate effect on expectations. Rare earths are among the critical inputs, where near-zero substitutability can completely stop production instead of just making it more expensive, as was the case with semiconductors in 2021. The export controls imposed by the Chinese Ministry of Commerce and the General Administration of Customs on April 4, 2025 on seven medium and heavy rare earths, including dysprosium and terbium, are deeply affecting specific sectors such as the defense industry and the automotive industry, but they do not have a retail price that shapes household expectations, so their footprint in the general index remains narrower.
Table 1: Eight Types of Supply Shocks by Transmission Channel, Amplifier and Inflation Impact
| Type of disruption | Typical example | Main transmission channels | Key amplifiers | Extent and duration of impact on inflation |
|---|---|---|---|---|
| Prices of commodities, in particular energy | Natural gas in Europe in 2022 | Cost of production, network of inputs and outputs, labour market | Low substitution, wage rigidity, price visibility that moves expectations | Very broad, in almost all industries, persistent when expectations become unanchored |
| Critical inputs | Semiconductors in 2021, rare earths in 2025 | Production costs, supply chain, pricing power | Zero short-term substitution, lean inventory, switching costs | Narrow but deep, with production interruptions in specific industries |
| Global supply chain | Freight rates and delivery delays 2020 to 2022 | Production costs, supply chain, network | Diffusion on the network, low stocks, expectations | Wide on goods through producer prices, less on services |
| Productivity | A sharp drop in input efficiency | Production costs, network | Capacity limits, market power, monetary policy that tolerates higher inflation | Wide, proportional to the size and duration of the drop |
| Import prices | U.S. tariffs on Chinese products | Production costs, chain reorganization, pricing power | Lack of domestic substitutes, higher margins for domestic competitors | Moderate and unequal between import and domestic companies |
| Labour supply | Reduced willingness to work during the pandemic | Labour market | Skills specialization, wage rigidity, expectations | Concentrated across industries, persistent through wages |
| Natural disasters | Tohoku earthquake in 2011 | Supply chain, production costs | Specialized suppliers, low inventory, hoarding | Initially local, then diffuse, often as shortages instead of price increases |
| Pandemic | COVID-19 | All channels at once | Limited factor mobility, little economic slack, expectations | Very broad, although precautionary savings can soften it |
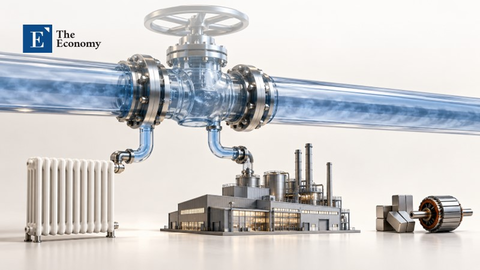
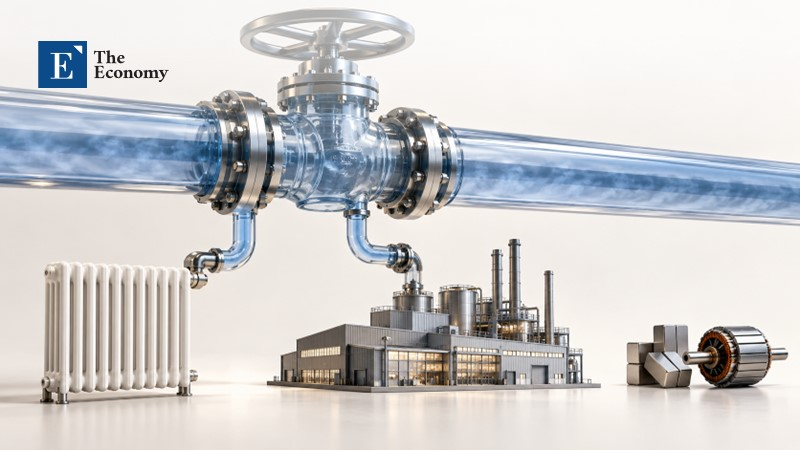
Energy is the only category in the table that combines the full range of industries with full price visibility and in the European case another layer is added, the precautionary demand generated by uncertainty about future availability. Rare earths can stop a magnet production line, while gas simultaneously raises the household heating bill and the cost of each plant that burns it for heat.
Credible Future Supply Works as an Anti-Inflation Tool
The usual counterargument in monetary policy is that central banks should look through energy supply disruptions because energy prices rise sharply and fall just as quickly. For flow disruptions, the argument stands, since their pass-through remains close to 1 percent and fades. For security of supply news, the data show the opposite, with a pass-through reaching around 5 percent a year later and Bank of Italy researchers had already shown in 2023 that gas supply disruptions leave more persistent traces on core inflation than oil shocks, which matches the core of the euro area index, which excluding energy, food, alcohol and tobacco stood at 5.0 percent in October 2022 according to Eurostat. The literature itself puts limits on this conclusion, as Ben Bernanke and Olivier Blanchard found that well-anchored long-term expectations narrowed the wage-price vicious circle in the United States, while Veronica Guerrieri and her colleagues showed that a supply shock can, when households cannot borrow, result in a drop in demand rather than inflation. The distinction between flows and news gives central banks a criterion for when looking through makes sense.
For energy policy, the success criterion shifts from the replacement of lost volumes to the reliability of supply in the coming years. Precautionary storage by private market participants is a logical reaction and its suppression would be harmful, while the issue is alternative sources that remain available beyond the immediate crisis, storage facilities to which access is guaranteed under pressure and a clear public explanation of how the needs of next winter will be met. Disruptions in flows through the Strait of Hormuz in 2026 brought the issue back to the table, with the International Energy Agency and the European Commission, which in its May 2026 spring forecast linked the slowdown in growth to the rise in inflation from the new energy shock, both describing a Europe with less dependence on fossil fuels than in 2022 but still exposed to global markets. The gas prices formed in these markets are less about current deliveries and more about what buyers think about the coming months.
The 10.6 percent in October 2022 and the 4.44 points that came from energy reflected to a significant extent the gas that markets feared would be missing, since most of the lost Russian volumes had already been replaced by other sources. Inflation from supply disruptions in Europe therefore followed a path that started with expectations, went through inventories and futures and ended with manufacturing costs and consumer prices, while a disruption to critical inputs such as rare earths would take a much shorter and narrower path. Whether Europe’s response to the 2026 shock turns out to be cheaper will largely be judged by the credibility its future supply will gain. Germany is already giving a measure of the stakes, with spending on gas imports that before the crisis did not exceed 0.8 percent of its gross national expenditure and with industrial production that, according to estimates, remained persistently below its baseline course after the disruption.
The views expressed in this article are those of the author(s) and do not necessarily reflect the official position of The Economy or its affiliates.
References
Alessandri, P. and Gazzani, A. (2023) ‘The impact of gas supply shocks in Europe’, VoxEU.org, 25 July.
Beaudry, P., Hou, C. and Portier, F. (2025) ‘The dominant role of expectations and broad-based supply shocks in driving inflation’, NBER Macroeconomics Annual, 39(1), pp. 235-276.
Bernanke, B. and Blanchard, O. (2025) ‘What caused the US pandemic-era inflation?’, American Economic Journal: Macroeconomics, 17(3), pp. 1-35.
Colombo, D. and Toni, F. (2025) ‘Gas prices and the macroeconomy’, SSRN Working Paper 5237587.
Edelberg, W. (2025) A taxonomy of supply shocks and their effects on inflation. Washington, DC: Brookings Institution.
Emiliozzi, S., Ferriani, F. and Gazzani, A. (2024) ‘The European energy crisis and the consequences for the global natural gas market’, VoxEU.org, 11 January.
European Commission (2026) Spring 2026 Economic Forecast: slowdown in growth as energy shock drives up inflation. Brussels: European Commission.
Eurostat (2022) ‘Annual inflation up to 10.6% in the euro area’, Euro indicators 130/2022, 17 November. Luxembourg: Eurostat.
Eurostat (2026) Harmonised index of consumer prices: monthly data, annual rate of change [prc_hicp_manr]. Luxembourg: Eurostat.
Kilian, L. and Murphy, D.P. (2014) ‘The role of inventories and speculative trading in the global market for crude oil’, Journal of Applied Econometrics, 29(3), pp. 454-478.
Ministry of Commerce of the People’s Republic of China and General Administration of Customs (2025) Announcement No. 18 of 2025 on the implementation of export control on certain medium and heavy rare earth related items. Beijing: Ministry of Commerce.
Working across research, policy, and data-driven analysis, the Editorial Board ensures that published pieces reflect a consistent institutional perspective grounded in quantitative reasoning and long-term structural assessment.