The Price of Inflating Away Public Debt: Why Bond Markets Demand Higher Interest Rates

Working across research, policy, and data-driven analysis, the Editorial Board ensures that published pieces reflect a consistent institutional perspective grounded in quantitative reasoning and long-term structural assessment.
Authored On
Modified
Inflation cut euro-area debt ratios by only three points
Treasury investors repriced inflation risk within fifteen months
Federal interest costs nearly tripled between FY2021 and FY2026

Most advanced countries saw their public debt grow well ahead of taxes over the past couple of decades. The high inflation experienced since 2021 naturally raised the prospect of inflating away this debt: if inflation exceeds coupon rates on government debt, creditors suffer negative real returns and the value of government liabilities falls. It has therefore been described as a stealth tax. However, new CEPR research indicates there was relatively little benefit to governments in the euro area from the recent inflation and U.S. data suggest subsequent increases in interest rates.
Why Inflating Away Public Debt Delivered Little in Europe
There are two mechanisms. Firstly, as noted above, all existing fixed-rate debt will provide negative real returns to investors as long as inflation exceeds the coupon paid. Secondly, if inflation reflects buoyant demand, then according to the Phillips curve, this will be associated with above-normal growth and increases in nominal GDP, lowering the debt-to-GDP ratio.
Boeckx, Iania and Wauters consider these two effects for the five largest governments in the euro area from 2005 to 2025, finding that inflation exceeding the inflation component embedded in government bond rates accounted for around 3 percentage points of reductions in their debt ratios. Real interest rates remaining lower than real growth over this period accounted for about 24 percentage points of reductions in debt ratios. Hence, low real interest rates were overwhelmingly more important than periods of higher-than-expected inflation.
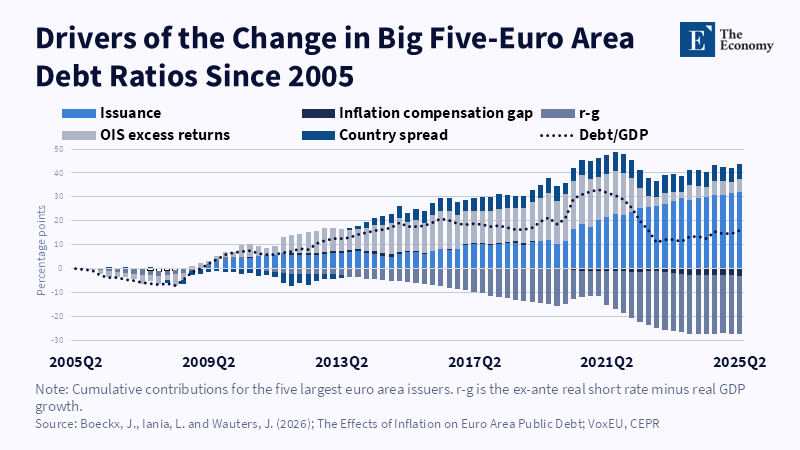
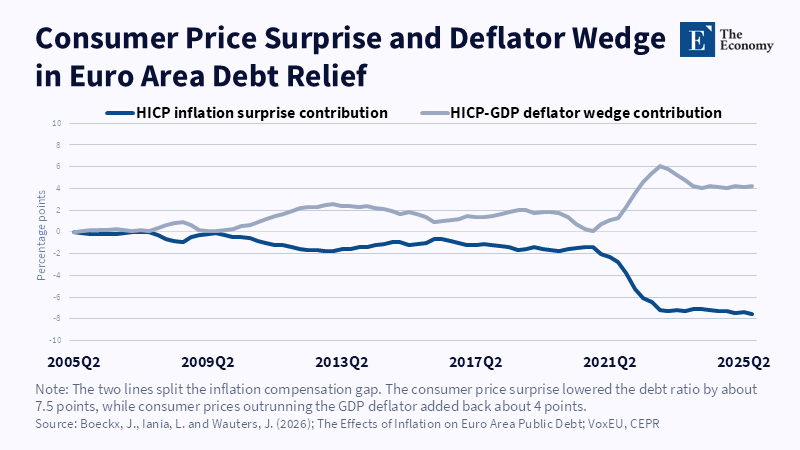
One reason is that much of the increase in prices in Europe since the pandemic reflected higher prices for supplies from the rest of the world, particularly fuel. Hence, although consumer prices rose sharply, the price level implicit in the value of domestic production, the GDP deflator, increased much less. As taxes are levied primarily on domestically generated income, there would be little corresponding increase in the level of domestic nominal income available to pay taxes and redeem domestic debt. Furthermore, growth would be lower rather than higher with such supply-driven inflation.
The Inflation Tax Returns as a Higher Interest Rate
Strictly speaking, seigniorage refers only to profits from printing currency, as Buiter set out in 2007. Reductions in the value of other pre-existing liabilities would be an additional transfer from those holding that debt to the government. Both can reasonably be referred to as an "inflation tax," and both are limited by the approximate relationship implied by the Fisher equation, that is, nominal interest rates reflect expected inflation plus real rates.
Clearly, only unexpected inflation results in such a transfer to the government, as holders of pre-existing debt will suffer. However, expected future inflation, or the perceived likelihood that a government with a large debt burden may be happy to live with high inflation, will lead to demands for higher interest rates when issuing new debt, plus a further premium to reflect the uncertainty of actual inflation. Thus, pre-existing debt would fall in value, but new issues would all be made at successively higher interest rates. The effect would be particularly marked for governments issuing largely short-dated debt, needing frequent re-access to capital markets and greater still if there were more general doubts over a government's fiscal policy. Once incurred, the higher rate would apply whenever new debt was raised.
What U.S. Treasury Yields Show About Inflation Risk
It is relatively straightforward to measure expected future inflation using data from U.S. Treasuries.
| Date | 10-year Treasury | 10-year TIPS | Breakevens |
|---|---|---|---|
| 4 January 2021 | 0.93% | -1.08% | 2.01% |
| 25 March 2022 | 2.48% | -0.47% | 2.95% |
| 19 October 2023 | 4.98% | 2.49% | 2.49% |
| 13 November 2026 | 5.15% | 2.91% | 2.24% |
Purchasers of 10-year bonds in January 2021 would have received just 0.93%, compared with CPI inflation reaching 9.1% according to BLS data for June 2022, in effect financing the Government at substantially negative real rates.
It is striking that the expected-inflation component of 10-year yields increased by 94bp between January 2021 and late March 2022, that is, much more than half the total increase in nominal rates and this at a time when official interest rates had only just started to increase. Hence, much of this increase must reflect investors' own reaction to higher inflation.
Subsequent developments are harder to interpret confidently. Breakevens have fallen since, with most of the rise in 10-year yields since 2022 reflected in higher real rates, reaching 2.91% on 13 November 2026, around 400bp more than in January 2021, with only about 23bp more for inflation compensation. Obviously, the increase in official rates, anticipated future increases, the quantity of new issues, the term premium and other factors will be reflected here. Clearly, not all of it could reasonably be ascribed to inflation.
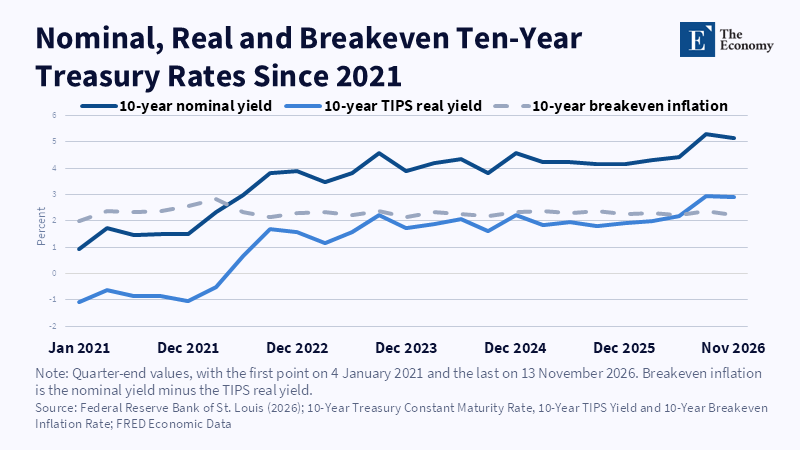
On the other hand, it seems reasonable to assume at least some impact of the earlier high inflation and losses suffered by investors as a result. They will presumably wish some degree of protection against recurrence when investing funds for 10 years and this may manifest itself as higher real rates and term premium as well as breakevens. Meanwhile, the 10 November auction of $42bn of 10-year notes cleared at yields up to 5.02% and real rates increased following the higher-than-expected CPI figure for October. It is not possible from these observations to judge how far real rates reflect penalties imposed on the U.S. Government following the inflation experience of a few years ago, as opposed to the high levels of deficit and resulting supply of government debt.
Refinancing Turns Higher Yields Into a Larger Interest Bill
From the overall budget position, these issues combine to produce large increases in interest payments, to around $1,100bn during FY2026, compared with around $392bn in FY2021, reflecting both higher levels of outstanding debt and higher rates at which it was rolled over. Debt held by the public rose to around $2,100bn during FY2026, with a deficit of around $2,000bn.
There must be substantial costs as long-standing lower-rate issues mature and have to be refinanced at around 5%. According to GAO data, Treasury held 444 auctions in FY2025, raising $1,900bn of new borrowing and refinancing $9,100bn of maturing debt. Hence, an ever greater proportion of outstanding debt will be at rates prevailing since around 2022, replacing issues made at much lower rates prior to that time, on which any benefit of inflation eroding the value of debt would have accrued.
It seems that holders of U.S. Treasuries did suffer losses from the 2021-23 inflation, although the degree to which this benefited the U.S. Government is questionable, judging by experience in Europe and in any event this is being increasingly offset by higher rates charged since. It is difficult to judge whether these have been sufficiently higher overall to more than compensate for the effect of inflation, given the number of influences on real rates. But it seems difficult to deny that there is an element of punishment for the earlier inflation, given 10-year real rates around 3%, compared with negative rates on issues made only about 5 years ago.
The views expressed in this article are those of the author and do not necessarily reflect the views of The Economy, its Editorial Board, or any affiliated institution.
References
Akitoby, B., Komatsuzaki, T. and Binder, A. (2014) Inflation and Public Debt Reversals in the G7 Countries. IMF Working Paper WP/14/96. Washington, DC: International Monetary Fund.
Bhatt, A., Diercks, A.M., Eyal, B. and Skaperdas, A. (2026) The Causal Effect of Debt on Interest Rates. Finance and Economics Discussion Series 2026-031. Washington, DC: Board of Governors of the Federal Reserve System.
Boeckx, J., Iania, L. and Wauters, J. (2026) ‘The effects of inflation on euro area public debt’, VoxEU, Centre for Economic Policy Research, 16 November.
Buiter, W.H. (2007) Seigniorage. CEP Discussion Paper No. 786. London: Centre for Economic Performance, London School of Economics.
Bureau of Labor Statistics (2022) Consumer Price Index News Release: June 2022. Washington, DC: U.S. Department of Labor.
Federal Reserve Bank of St. Louis (2026) FRED Economic Data: 10-Year Treasury Constant Maturity, 10-Year TIPS Yield and 10-Year Breakeven Inflation Rate. St. Louis: Federal Reserve Bank of St. Louis.
U.S. Department of the Treasury (2026) Auction Results: 10-Year Note, 10 November 2026. Washington, DC: Bureau of the Fiscal Service.
U.S. Government Accountability Office (2026a) Federal Debt Management: Treasury Is Meeting Borrowing Needs but the Deteriorating Fiscal Outlook Poses Risks. GAO-26-107529. Washington, DC: GAO.
U.S. Government Accountability Office (2026b) Financial Audit: Bureau of the Fiscal Service’s FY 2026 and FY 2025 Schedules of Federal Debt. GAO-27-108795. Washington, DC: GAO.
Working across research, policy, and data-driven analysis, the Editorial Board ensures that published pieces reflect a consistent institutional perspective grounded in quantitative reasoning and long-term structural assessment.