[Longevity and Inequality] Public Pension Systems and Unequal Life Expectancy in Sweden

He is the founder of the Better Public Authorities Foundation, an initiative focused on improving the quality and effectiveness of public administration. Settergren has written extensively on pension finance and pay-as-you-go pension systems and holds a degree from the Stockholm School of Economics. In 2026, he received an honorary doctorate in economics from the University of Cassino and Southern Lazio in recognition of his work on Sweden's pension system.
Authored On
Modified
The Swedish system calculates pensions with a single life expectancy for all insured persons
The widening of the longevity gap between high and low incomes made the redistribution of the system reverse
The differentiation of pensions by life expectancy is possible, but whether it is desirable remains open

Conference context
This article was written by Ole Settergren, Founder of Better Public Authorities Foundation, as a public-facing follow-up to his presentation, “Can Inequalities in Longevity Be Taken into Account in Public Pension Systems – and Would It Be Appropriate to Do So?” delivered at the conference Inequalities in Longevity, held at Fondazione Giorgio Cini in Venice on 3–4 July 2026. It develops the central argument of the presentation, that public pension systems can account for differences in life expectancy, while whether they should do so is a much more difficult question.
Watch the original conference presentation: Ole Settergren at Fondazione Giorgio Cini on YouTube
Every old-age pension system is based on a simple insurance principle. Those who die earlier than expected finance those who live longer and without this transfer, there would be no longevity insurance, only compulsory individual savings. The principle works fairly as long as groups sharing the same common risk do not systematically differ in how long they live, which is no longer the case in Sweden. According to data from the Swedish Pensions Agency, in 2022 those with a high lifetime income had a 2.9-year longer remaining life expectancy at the age of 65 than those who had a low one, with men and women calculated together. A system that applies the same life expectancy to everyone thus pays, on average, more years of pension to those who earned more during their working lives. The question that arises has two parts and only the first is easy to answer: whether public pension systems can reflect differences in life expectancy and whether they should do so.
Sweden’s Annuity Divisor Turns Notional Capital into a Pension
Italy and Sweden radically reformed their public pension systems in the first half of the 1990s. The process started a little earlier in Italy, where legislation was passed faster, while in Sweden the transition from the old to the new rules proceeded faster and was effectively completed by 2020. Both are described as Notional Defined Contribution schemes, known as NDCs, which combine elements of defined contribution schemes with pay-as-you-go financing. Pensions are calculated as if each insured person had accumulated an individual account, but no corresponding financial assets are set aside, so the accounts are notional rather than funded. The detailed rules of the two countries differ considerably, but both convert the accumulated capital into an annual pension based on unisex remaining life expectancy at retirement and a ‘front-loading rate’ and the analysis here is limited to the Swedish case.
In Sweden, the pension is obtained by dividing the notional capital of the insured person by an annuity divisor. The capital includes all contributions paid by or on behalf of the insured person, adjusted each year according to the increase in average earnings, which acts like an interest rate. The divisor reflects the single remaining life expectancy of the generation at the age when the pension is first claimed and an assumed annual rate of increase in average earnings, fixed in law at 1.6%, while pensions are adjusted each year upwards or downwards according to the difference between the actual and the assumed increase in wages. The final divisors are set when each generation reaches 65, with a five-year moving average and the most recent mortality tables and with the recent increase in the earliest claiming age, the age at which divisors are finalised is now 66, will become 67 in 2027 and will then be linked to life expectancy. The update is done automatically every year, without a decision by the parliament or the government.
Without the assumption of 1.6%, the divisor would be exactly the same as the remaining life expectancy of each generation at each age. The assumption reduces it by about 18% at 65 and raises the initial pension accordingly, in exchange for an annual indexation that falls short of the increase in average earnings by 1.6%. The divisor decreases as the age of first receipt increases, so the monthly pension increases, while the increase in life expectancy raises the divisors of each younger generation and lowers its initial pension, with the design seeking an incentive for a later departure from work so that the level of pension remains stable from generation to generation.
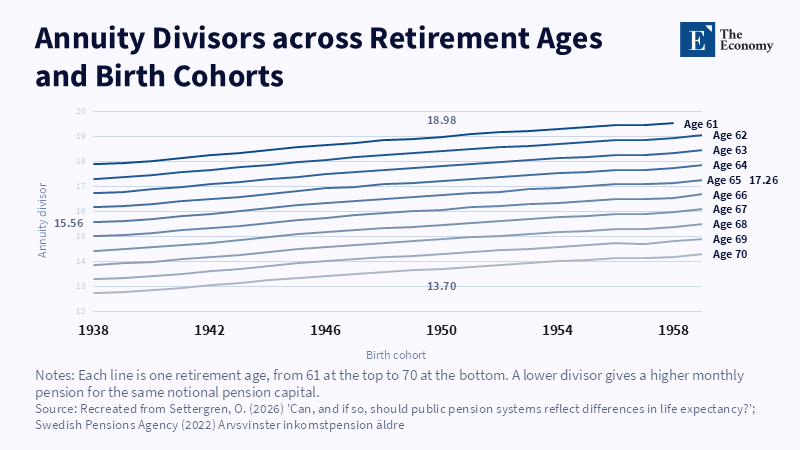
For the 1950 generation, postponing retirement from 61 to 70 reduces the divisor from 18.98 to 13.70 and increases the monthly pension by about 40% for the same notional capital, a higher pension that is naturally expected to be paid for fewer months. In practice, the increase is much greater. In these nine years, the capital continues to be adjusted with the increase in average earnings, while a pension received earlier is indexed to average earnings growth minus 1.6%, which in itself raises the pension of 70 by about 15% compared to that of 61, those who wait receive additional inheritance gains from members of their generation who die before receiving a pension, about another 10% at 70 and every income from work in the meantime generates new contributions, since there is no upper age for acquiring pension rights even if the pension is already paid.
The same chart shows the effect of increasing longevity on successive generations. At 65, the divisor rose from 15.56 for the 1938 generation to 17.26 for the 1959 generation and the initial monthly pension was reduced by about 10%, but the pension is expected to be paid over a longer period, so the expected total benefits remain unchanged for the same capital. Divisor, inheritance gains and indexation are designed so that the expected value of lifetime benefits is the same regardless of the age of first claim and generation and this is the actuarial neutrality of the Swedish NDC, which ensures basic fairness between and within generations. A technical detail complicates the picture. The life tables used are based on observed rather than predicted mortality, so they systematically underestimate life expectancy as it increases, creating a tendency for actuarial deficits that are eventually absorbed by the automatic balancing mechanism.
Unisex Life Expectancy Once Favored Low Earners, Now High Earners
The actuarial fairness of the system applies only to the insured population as a whole. Individuals, governments and insurers have information that allows a more accurate estimate of the life expectancy of specific groups than the average of an entire generation, with gender being the most obvious example. Women live longer on average, so a woman and a man of the same generation with the same notional capital and the same retirement age receive the same monthly pension, while the woman is expected to receive it for longer and therefore receive higher total benefits. Actuarially, this is a transfer from men to women, which the Swedish legislators did not consider a weakness but, in many cases, a desirable result, since the lower lifetime earnings of women, in a system that closely links contributions and benefits, lead to lower monthly pensions and the single life expectancy partially compensates for the difference when the gaze turns from the monthly to the total pension.
The use of life expectancy by gender never seems to have been seriously discussed and today both Swedish and European legislation prohibit such discrimination. Little attention has thus been paid to the contradiction between the promotion of actuarial fairness as a key feature of the reform and the conscious departure from it whenever it served a politically desirable redistributive effect. There is, however, a legitimate defence of the Swedish design: social security generally treats all insured persons as members of a single risk pool and, unlike private insurance, does not differentiate contributions or benefits on the basis of individual characteristics. At the time of the reform, uniform life expectancy had a second consequence, since by favouring women it also favoured low-wage earners. In the mid-1990s, men with higher lifetime earnings lived longer than men with lower lifetime earnings, as was probably always the case and the same was true for women, but in the population as a whole, the combination of lower earnings and longer life expectancy gave low-wage earners a slightly longer average life expectancy than high-wage earners and the system functioned mildly progressively.
This observation has never been documented in a formal study and the picture has now changed. A 2024 report by the Swedish Pensions Agency shows that the much faster increase in life expectancy among men with high incomes has changed the overall picture, with the progressive effect of the system gradually fading and now appearing to have been reversed, i.e. transferring resources from the poorest to the richest. The increasingly strong positive relationship between income and life expectancy in Sweden is thoroughly documented by a study published in the Proceedings of the National Academy of Sciences in 2025, covering six decades of data.
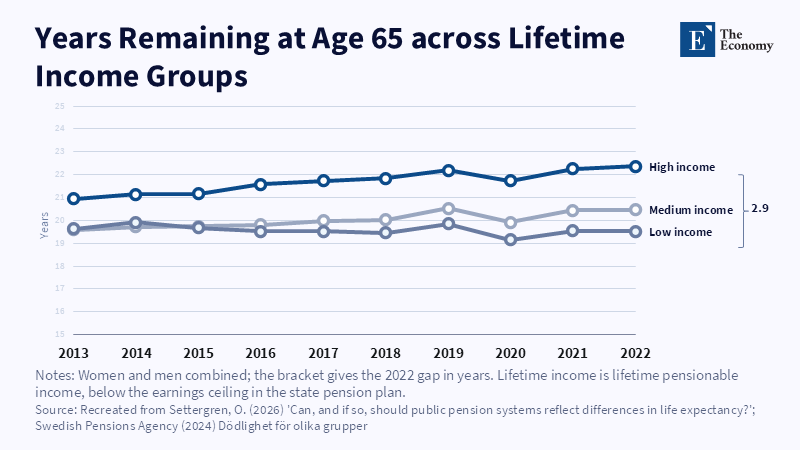
The data starts in 2013, so the chart does not show exactly when the transition from progressive to reverse redistribution occurred. To accurately pinpoint differences, differences in remaining life expectancy would have to be translated into corresponding annuity divisors rather than just considered as years of life and the relationship between the two is not perfectly proportional because the institutionalized 1.6% increase assumption affects the divisor somewhat differently depending on the remaining life expectancy of each group.
The Life Expectancy Gap Is Widest among Men
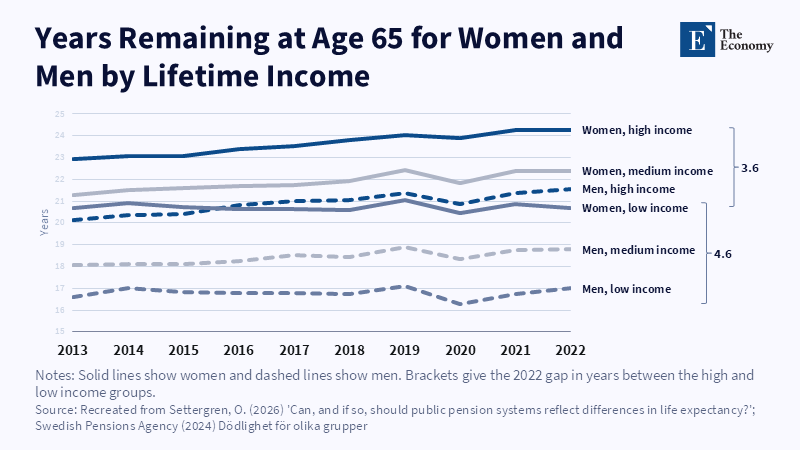
When the same data are broken down by gender, it stands out that the variation in life expectancy by income is significantly greater in men than in women. The difference between high and low incomes reaches 4.6 years for men, compared to 3.6 years for women. In both groups, the high-income lines rise steadily over the decade while the low-income lines remain almost at the same level.
Income is just one of many factors linked to differences in life expectancy and the composition of the household provides another clear example. Those who live with a partner, usually married or cohabiting, have a significantly longer life expectancy than those who live alone and here again the differences are much larger in men, with 4.7 years compared to 3.0 years for women.
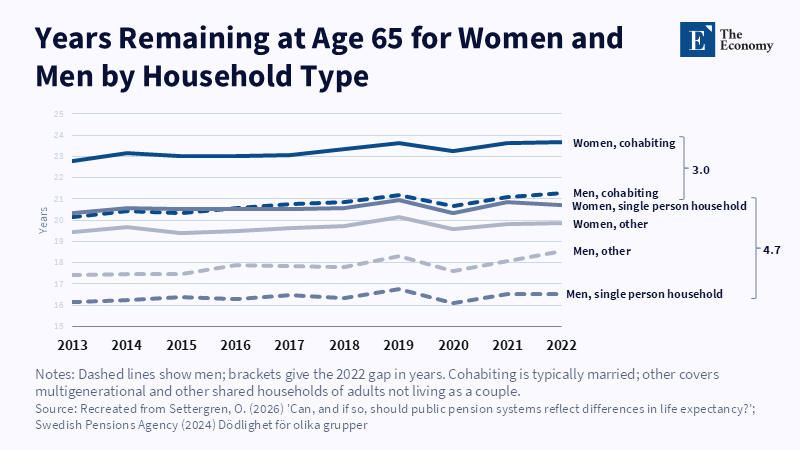
These differences are closely linked to socio-economic conditions. In Sweden, the income gap between married and single women is relatively small, while the corresponding gap among men is much larger and single men are generally worse off economically, socially and in terms of health than married men whereas the differences between single and married women are much less pronounced.
Public Pension Systems Can Differentiate, but Whether They Should Remains Open
In the first part of the question, the answer is simple because they can. Both the Italian and Swedish NDCs could calculate separate life expectancy for different groups of insured persons and use it to convert capital into a pension, since the data already exist and the calculations are not complicated, while traditional defined benefit systems could do the same by other means, adjusting the monthly benefit or the usual retirement age per group. A natural starting point would be lifetime earnings, which are linked to life expectancy, already recorded by pension authorities and measured objectively. Education, occupation, household composition and place of residence are also linked to systematic differences and correlate with each other, so the choice of classification is both an empirical and a normative question.
The second part is much more difficult. The common risk pool is a fundamental feature of social security and with a few exceptions, such as Chile, public pension systems around the world do not differentiate benefits either by gender or by any other characteristic. But there is also an equally accepted principle of public policy that the state should not design institutions that systematically redistribute income from the poorest to the richest citizens. In sickness, disability and unemployment insurance, contributions are proportional to earnings and the rules are largely uniform and because low-wage earners face higher risks, these programs usually redistribute from higher to lower incomes. If earnings-linked pensions move in the opposite direction, they become an exception among the major branches of social security and whether this is acceptable should be explicitly analyzed, not considered an unintended side effect of pension design.
Differentiating the calculations by life expectancy raises questions that are difficult to close satisfactorily. The first concerns classification, since lifetime earnings seem like the most natural criterion, but gender, education, occupation, household, place and health status also predict longevity. Once the principle is accepted, it is difficult to define where it stops. The second concerns incentives and their moral dimension: if someone moves into a longer life expectancy category as their earnings increase, a small increase can mean a significant loss of total income through lower future pensions and the smoothing that could limit it would make the system more complex and less transparent. The third is institutional. Trust in pensions is based on simplicity, predictability and legitimacy and differentiation may simply shift the political debate to the choice of variables, although a system that redistributes upwards may, justifiably, also lose its legitimacy.
For these reasons, legislators have good reason to be cautious, and the alternatives lie in other policy tools. Means-tested minimum pensions, housing allowances for pensioners, and progressive taxation can address differences in lifetime economic resources without changing the system’s actuarial structure. The Swedish occupational system points to yet another institutional solution: blue-collar and white-collar workers participate in different, collectively negotiated schemes, each using the average life expectancy of its own insured population, so blue-collar workers, with typically lower life expectancy, benefit relative to a system based on the whole workforce. A greater shift to occupational or private schemes could be the answer if the redistribution of the public system were considered politically unacceptable and internal differentiation undesirable, but even such a change would be politically and administratively difficult.
The key figures and arguments of the analysis are summarized in the table below.
Table 1: Life Expectancy Gaps and Their Implications for Swedish Pension Design
| Issue | Key Element | Implication for pension policy |
|---|---|---|
| Retirement age | 1950 generation: divisor 18.98 at 61 and 13.70 at 70 | The postponement increases the monthly pension by well over 40% |
| Rising longevity | At 65: a divisor of 15.56 for the 1938 generation and 17.26 for the 1959 generation | Approximately 10% lower initial pension, same expected total value |
| Income, men and women together | Difference of 2.9 years in life expectancy at 65 in 2022 | The single life expectancy now favors high incomes |
| Income by gender | 4.6 years in men, 3.6 in women | The gap is deeper in men |
| Household composition | 4.7 years for men, 3.0 for women | Men who live alone have the lowest life expectancy |
| Technical capability | Data and calculations are already available | Differentiation is possible |
| Desirability | Classification, incentives, institutional legitimacy | Strong reasons for caution |
| Alternatives | Minimum pension, housing allowance, progressive taxation, occupational schemes | Redistribution without changing the actuarial structure |
The positive relationship between income and life expectancy within each gender has historically been well documented, meaning that the risk of pension systems shifting resources from those with lower lifetime incomes to those with higher ones has always existed, and strengthening this relationship has made it, at least in Sweden, a reality. Differentiating the calculations would require legislators to decide which individual characteristics count and to weigh greater actuarial accuracy, likely based on a selective set of characteristics, against more complexity, less transparency and possibly undesirable incentives. Current evidence is not yet sufficient to justify such differentiation within public systems, but it is sufficient for much more extensive research, and the distributional effects of the widening gap in life expectancy need more attention from researchers and legislators than they have received so far. Whether the answer will be found in pension design itself or in other redistributive policies remains an open question, with the 2.9-year difference of 2022 as the point from which the debate begins.
Publication note
This article develops arguments originally presented by the author at the conference Inequalities in Longevity, held at Fondazione Giorgio Cini in Venice on 3–4 July 2026. It was independently published by The Economy Review and is not an official transcript, abstract, or part of the conference proceedings. Reference to the conference describes the intellectual origin of the article and does not imply institutional endorsement or partnership. The analysis, interpretations, and conclusions are those of the author.
References
Barr, N. and Diamond, P. (2008) Reforming Pensions: Principles and Policy Choices. Oxford: Oxford University Press.
Chetty, R., Stepner, M., Abraham, S., Lin, S., Scuderi, B., Turner, N., Bergeron, A. and Cutler, D. (2016) ‘The association between income and life expectancy in the United States, 2001-2014’, JAMA, 315(16), pp. 1750-1766.
Gronchi, S., Nisticò, S. and Bevilacqua, M. (2023) ‘Increasing longevity, NDC implementation in Italy and Sweden, and all that’, European Journal of Social Security, 25(3), pp. 261-287.
Hagen, J., Laun, L., Lucke, C. and Palme, M. (2025) ‘The rising income gradient in life expectancy in Sweden over six decades’, Proceedings of the National Academy of Sciences, 122(14), e2418145122.
Holzmann, R. and Palmer, E. (eds) (2006) Pension Reform: Issues and Prospects for Non-Financial Defined Contribution (NDC) Schemes. Washington, DC: World Bank.
Swedish Pensions Agency (2024) Dödlighet för olika grupper [Mortality for different groups]. Stockholm: Pensionsmyndigheten.
He is the founder of the Better Public Authorities Foundation, an initiative focused on improving the quality and effectiveness of public administration. Settergren has written extensively on pension finance and pay-as-you-go pension systems and holds a degree from the Stockholm School of Economics. In 2026, he received an honorary doctorate in economics from the University of Cassino and Southern Lazio in recognition of his work on Sweden's pension system.